
By Kevin Zeng, Operations Director · Research cut-off: 13 October 2026
Demand, cost, product-mix and sourcing signals for cutting-tool buyers, distributors and manufacturers
Research cut-off: 13 October 2026 Historical period: 2021–2025 Current-year basis: 2026 year-to-date data, using the latest available month for each series Outlook period: 2027–2030
Report version: 1.3
Estimated reading time: 42 minutes
This report covers cutting tools used in CNC production machining. It does not treat machine tools, toolholders, workholding, abrasives, metrology equipment or manufacturing software as cutting-tool revenue, although those categories are considered where they change tool demand or the economics of tool use.
The central conclusion is that cutting-tool demand cannot be inferred from manufacturing output alone. It is determined by the interaction of part volume, workpiece material, machining content, machine utilization, edge-consumption rate, tool price and product mix, customer inventory, reconditioning and qualification requirements. The 2026 market must therefore be read through six lenses: volume, price, mix, region, end market and inventory.
Evidence labels used in this report:
- FACT — directly reported by a named primary or authoritative source.
- COMPANY DISCLOSURE — reported by a company; useful but not necessarily comparable with other companies.
- INDUSTRY INFERENCE — a reasoned transmission from reported evidence; not a reported market fact.
- BASE-CASE ASSUMPTION — an explicit scenario assumption used for 2027–2030.
- HENTRY VALIDATION REQUIRED — a supplier-specific conclusion that must be tested against a drawing, quotation, trial or production record before it becomes a capability claim.
Report Map by Part
| Part | Sections | Review question |
|---|---|---|
| I. Scope, data and measurement | 1–3 | What can be concluded, and what can be measured reliably? |
| II. Cycle and regions | 4–5 | How does demand transmit through utilization and inventory? |
| III. End markets | 6–8 | Which parts, materials and features create tooling demand? |
| IV. Product and technology migration | 9–12 | Which product, material and digital shifts change value? |
| V. Supply chain, capacity and competition | 13–16 | How do cost, capital, moats and business models affect earnings? |
| VI. Buying, opportunities and outlook | 17–20 | What should buyers and suppliers do through 2030? |
1. Executive Summary
1.1 Ten conclusions for 2026
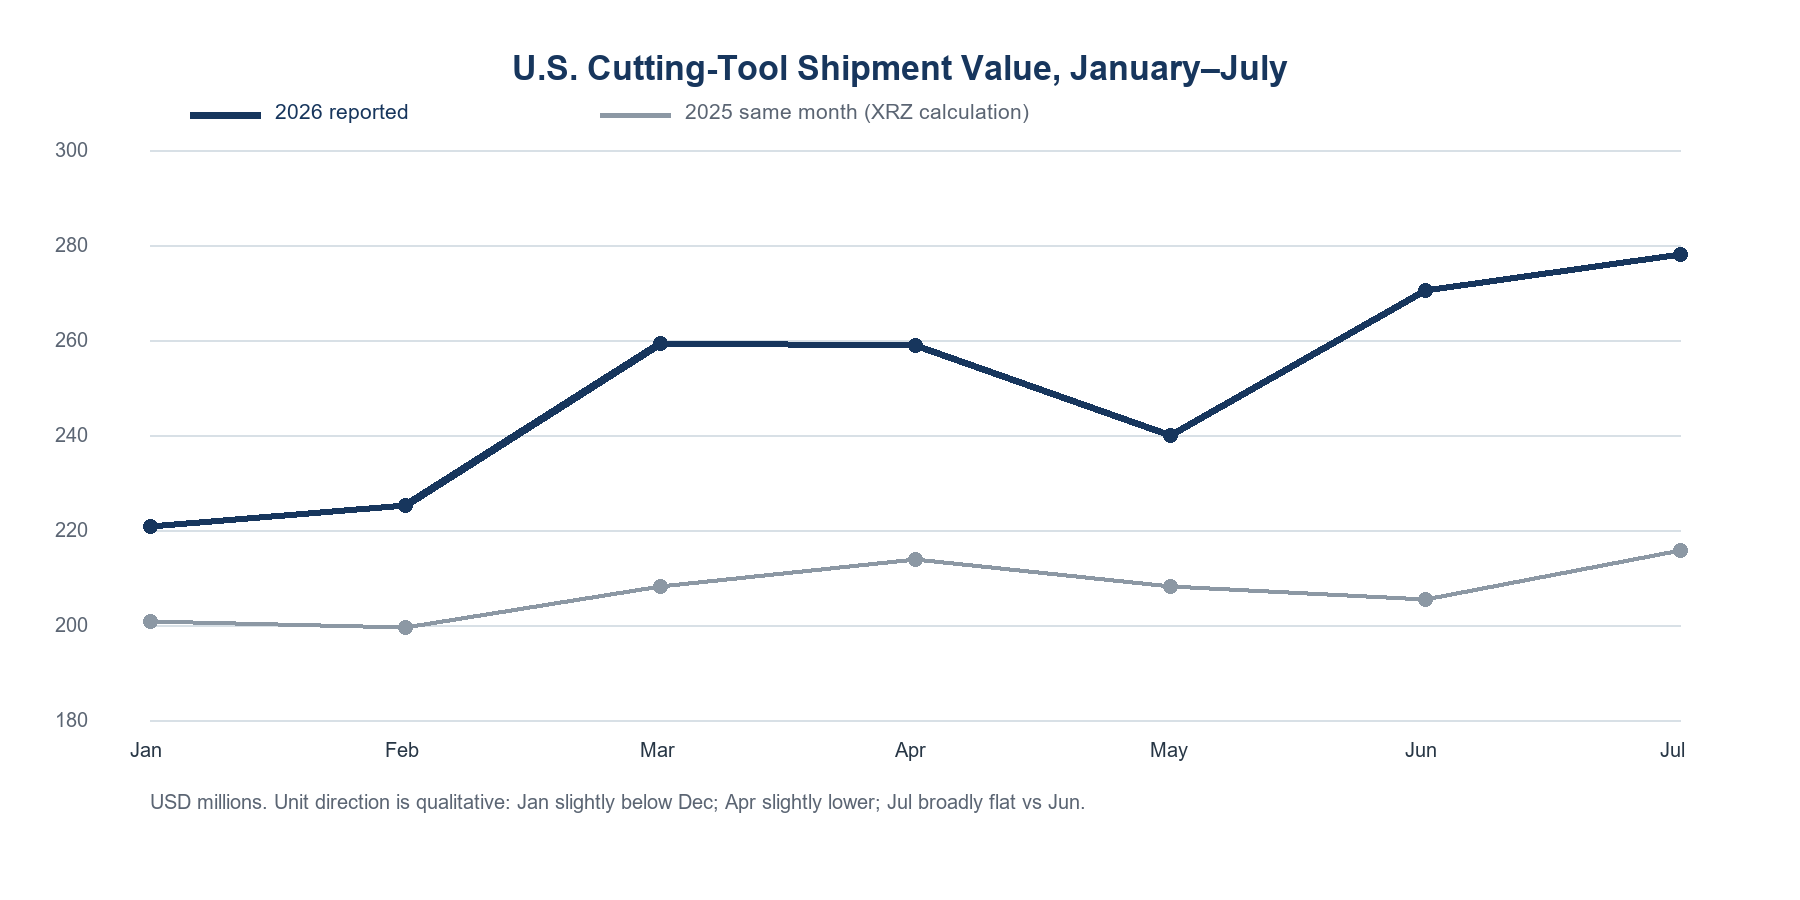
Evidence note for Table 1. Sources: AMT/USCTI, VDW, CECIMO, Airbus, Boeing, OICA, ACEA, USGS, Kennametal and China NBS.[1]–[12] Periods range from FY2025 to September 2026. Values are shipments, orders, production, deliveries or company disclosures—not one comparable market-size series. Last updated 13 October 2026.
| Conclusion | Supporting evidence | Most affected parties | Confidence | What to monitor |
|---|---|---|---|---|
| 1. The 2026 recovery is real in parts of the market, but it is not broad or uniform. | FACT: U.S. cutting-tool shipments reached $278.1 million in July 2026, up 29% year on year; German machine-tool orders rose 14% in H1, while European 2025 machine-tool production had fallen 6.6%.[1][2][3] | Tool manufacturers, distributors, procurement teams and machining companies | High for direction; medium for persistence | Monthly shipments, unit shipments, orders and distributor inventory |
| 2. Nominal revenue is rising faster than physical demand in several channels. | FACT: AMT/USCTI reported that July U.S. shipment value increased while unit shipments were broadly unchanged from June. Kennametal attributed FY2026 performance partly to pricing in an exceptional tungsten environment.[1][11] | Procurement, distributors and manufacturers | High | Units, realized price, raw-material surcharges and gross margin |
| 3. Tungsten has become a working-capital and quotation problem, not only a purchasing problem. | FACT: USGS reported that Rotterdam APT prices rose from $331 to $675 per metric ton unit during 2025. Kennametal reported higher inventory value and prepayments connected with tungsten, which weighed on operating cash flow.[10][11] | Carbide-tool producers and distributors | High | APT, rod prices, inventory days, quotation validity and customer acceptance |
| 4. Aerospace is the clearest structural demand driver, but backlog does not equal immediate tool consumption. | FACT: Airbus reported 547 deliveries through September 2026 and a 9,222-aircraft commercial backlog at 30 June; Boeing reported a commercial-airplane backlog above 6,200 at Q2.[5][6][7] | Aerospace-qualified tool suppliers | High on backlog; medium on conversion timing | Deliveries, supplier output, engine/MRO activity and qualification lead time |
| 5. Automotive demand is changing machining content rather than simply disappearing. | FACT: OICA reported 96.4 million vehicles produced in 2025, up 3.9%. EU H1 2026 registrations grew 5.7%, with battery-electric share at 20.7% and hybrid share at 37.3%.[8][9] | Automotive tool suppliers | High | Powertrain mix, aluminum housing programs, hybrid volumes and platform launches |
| 6. China combines strong equipment-manufacturing growth with high price pressure. | FACT: China’s equipment-manufacturing value added grew 9.7% year on year in the first seven months of 2026, while overall manufacturing grew 5.6%.[12] | Exporters, local producers and distributors | High for activity; medium for cutting-tool realization | Capacity utilization, vehicle output, machinery output, export prices and receivables |
| 7. Custom and combination tools can improve process economics, but engineering cost can erase the premium at low volume. | INDUSTRY INFERENCE: value comes from fewer operations, controlled datum relationships and less changeover, but only when sections share a usable cutting window and repeat demand covers design and trial cost. | Process engineers and custom-tool suppliers | Medium-high | Repeat orders, engineering hours, sample conversion and accepted-part cost |
| 8. Regrinding can improve lifecycle value and customer retention, but it delays new-tool replacement and adds logistics complexity. | INDUSTRY INFERENCE: reconditioning changes revenue timing and the installed-tool base; its economics depend on recoverable geometry, collection density and inspection control. | Manufacturers and distributors | Medium | Regrind share, turnaround, recovery rate and new-versus-reground mix |
| 9. Digital tool data is becoming part of the supplied product. | FACT: ISO 13399 provides a system-independent representation for cutting-tool data; newer industrial models connect static geometry with actual measured and process data.[20][21][22] | OEMs, automated plants and suppliers | High on direction; medium on adoption speed | Requests for 3D models, tool IDs, preset data, revision records and CAM packages |
| 10. HENTRY’s most defensible growth path is precision holemaking and drawing-based application work, not a claim to cover every high-growth niche. | INDUSTRY INFERENCE: PCD reamers, carbide drills, combination tools and sample validation align with repeatable hole-quality problems and measurable accepted-part economics. | HENTRY management and channel partners | Medium until internal data are added | Qualified RFQs, trial conversion, repeat orders, scrap reduction and application evidence |
1.2 Industry and Commercial Judgment
The evidence is most consistent with a mixed cyclical recovery amplified by price and product mix, rather than a synchronized global volume upturn.
The U.S. cutting-tool series gives the clearest direct signal. Full-year 2025 shipments were $2.56 billion, only 2.5% above 2024. By July 2026, monthly shipment value was up 29% year on year, but the same release said units were steady from June. That combination is important: rising revenue does not prove equivalent growth in physical consumption. Price increases, a shift toward higher-value tools, buy-ahead and unusually expensive tungsten can raise shipment value while unit demand moves less.
Europe offers a different timing signal. CECIMO estimated that European machine-tool production fell to €23.5 billion in 2025, down around 6.6%, and described the 2026 recovery as fragile. Germany then reported machine-tool orders up 15% in Q1 and 12% in Q2. Orders are a leading indicator of future machining capacity, not current cutting-edge consumption. Tool demand should improve only when ordered machines are built, installed, accepted, loaded with parts and run at useful utilization.
High-value tools are likely to be more resilient than commodity tools where the customer’s loss from a failed edge is large. This does not mean every PCD, PCBN or custom tool earns a high margin. The supplier must recover application engineering, small-batch setup, inspection, sample tools and rejected designs. Premiumization is economically real only when the supplier can demonstrate one or more of the following under comparable conditions: more accepted parts, shorter cycle, fewer tool changes, lower scrap, lower inspection burden or a drawing requirement that the lower-cost route cannot hold consistently.
The strongest structural themes are aerospace backlog, difficult materials, automated production, traceable tool data, process consolidation and regional supply resilience. The themes most likely to be overstated are generic “AI tooling,” universal high-speed machining claims and assumptions that electrification removes or creates tool demand in a simple one-for-one relationship.
1.3 Opportunity and risk summary
| Demand / HENTRY fit | Interpretation | Examples | Required action |
|---|---|---|---|
| High demand + existing or adjacent HENTRY capability | Highest commercial priority, subject to evidence | Aluminum precision holes, PCD reaming, carbide drilling, drill–ream–chamfer tools | Build application evidence, sample-validation packages and repeat-supply records |
| High demand + capability to be confirmed | Attractive research pipeline, not a public capability claim | CFRP stack tools, aerospace titanium/nickel applications, digital tool-data packages | Verify equipment, geometry, material route, reviewer and trial scope |
| Lower demand + existing capability | Serve selectively through distributors or drawing-based projects | Low-volume special tools, mature ICE-only components | Control engineering cost and minimum economic order |
| Lower demand + no evidence | Do not prioritize | Unrelated broad catalog categories or applications requiring unverified processes | Monitor; do not build positioning around them |
The main risks are a false reading of nominal growth as volume growth; customer buy-ahead followed by destocking; raw-material price escalation; long aerospace qualification cycles; automotive platform delays; price competition in standard tools; and working capital tied up in slow-moving sizes, PCD/PCBN blanks, carbide rod and unfinished custom tools.
2. Research Scope and Methodology
2.1 Industry definition
This report defines a cutting tool as the cutting item or tool assembly that removes material through one or more defined cutting edges. It includes indexable inserts, solid round tools, reamers, boring tools, PCD and PCBN tools, custom form and combination tools, and associated regrinding or lifecycle services where those services are directly tied to the cutting tool.
It excludes machine tools, spindle systems, standalone toolholders, workholding, conventional abrasives, metrology hardware and manufacturing software from market revenue. These categories remain relevant as demand drivers. For example, machine-tool orders can lead future tool consumption; holder runout can determine drill and reamer performance; and CAM data can determine whether a tool is easy to adopt. They must not, however, be added to cutting-tool revenue.
2.2 Statistical boundary
Market comparisons should use four explicit scopes:
1. Consumable cutting items: replaceable inserts and other cutting items.
2. Complete cutting tools: solid tools and assembled/indexable tools.
3. Special tooling: drawing-based form, combination, PCD and PCBN tools.
4. Lifecycle services: regrinding, recoating, repair, presetting or tool management when separately measured.
Double counting can occur when an insert and the cutter body are both counted, when a distributor’s resale is added to the manufacturer’s shipment, or when PCD blanks are added to the finished tool that contains them. A global estimate must specify whether it measures production, manufacturer sales, distributor sales or end-user consumption.
2.3 Time, currency and revision rules
Every dataset used in the supporting research table should record:
- observation month, quarter or fiscal year;
- source publication date and revision date;
- nominal or constant-price basis;
- reporting currency and conversion date;
- organic, reported or acquisition-adjusted growth;
- product and geographic scope;
- whether inventory movement is visible;
- whether the number is a shipment, order, sale, production or consumption measure.
No 2026 YTD number is presented as a full-year result. Company fiscal years are not silently converted into calendar years. Foreign-currency translation is separated from operating growth whenever the company discloses it.
2.4 Facts, inference and forecasts
A fact answers what was reported. An industry inference answers how that fact may transmit into cutting-tool demand. A forecast states what must be true for a future outcome to occur.
Example:
- FACT: Airbus delivered 547 aircraft in the first nine months of 2026.
- INDUSTRY INFERENCE: higher deliveries should increase machining load somewhere in the airframe, engine and supplier system, but the location and timing depend on inventory, outsourcing and bottleneck removal.
- BASE-CASE ASSUMPTION: deliveries continue to rise through 2030 without a severe demand or supply interruption.
- HENTRY VALIDATION REQUIRED: HENTRY has qualified products, documentation and channel access for a named aerospace machining task.
2.5 Resolving conflicting market estimates
Two market-size estimates should not be averaged until their boundaries match. The review sequence is:
1. Does each estimate cover cutting tools only?
2. Does it include holders, workholding, abrasives or machinery?
3. Is it manufacturer revenue, channel revenue or end-user expenditure?
4. Are lifecycle services included?
5. Are inserts and cutter bodies double counted?
6. Are data nominal, and which currency rate is used?
7. Does the estimate include China domestic sales and unlisted manufacturers?
8. Is the report extrapolating from a small sample?
When these questions cannot be answered, the estimate is not decision-grade.
Section judgment: source discipline matters more than apparent precision. Every number should retain its time period, currency, product boundary and evidence label through analysis and publication.
3. Why Published Cutting Tool Market Estimates Differ
3.1 The boundary problem
There is no single public, audited global cutting-tool total built on one product, channel and geographic boundary. Commercial studies often publish precise values, but the reader may not be able to verify whether they include toolholders, abrasives, lifecycle services, distributor markups, PCD/PCBN specials or only standard consumables. A precise number with an opaque boundary is not decision-grade.
This report therefore does not publish a proprietary global market-size estimate. Public datasets are used to interpret direction and structure, not to manufacture a false point estimate. The U.S. AMT/USCTI series is a useful shipment indicator under its own participant and product scope; it is not a global proxy. Company segment revenue is also informative but cannot be added without removing acquisitions, non-tool products, intra-group sales and channel duplication.
3.2 What can be measured
A defensible model begins with four separate scopes:
1. Consumable cutting items: inserts and replaceable cutting items.
2. Complete cutting tools: solid tools and assembled or indexable tools.
3. Special tooling: drawing-based form, combination, PCD and PCBN tools.
4. Lifecycle services: regrinding, recoating and tool management when separately measured.
For a region with compatible customs and production data:
Apparent consumption = domestic production + imports − exports
If reliable inventory information exists, a second measure can be estimated:
Estimated end-use consumption = apparent consumption − inventory build + inventory drawdown
The two terms must not be combined under the label “apparent consumption.” Re-exports, transfer pricing, mixed customs codes and distributor markups remain important limitations.
3.3 Revenue is not volume
Reported revenue growth should be decomposed into volume, price/mix, foreign exchange, acquisitions and portfolio changes. The 2026 evidence makes this separation essential. U.S. shipment value accelerated while reported unit direction did not always move with it.[1] Kennametal described both price and volume effects in an exceptional tungsten environment.[4][11] Mitsubishi Materials’ Metalworking Solutions comparison included an acquired tungsten business.[24]
The most useful public conclusion is therefore structural: cutting-tool demand is large and fragmented, but its global value cannot be reduced to a trustworthy single number from currently available public data. Decisions should be based on the addressable application, accepted-part economics, channel access and documented supplier capability.
Section judgment: source discipline matters more than apparent precision. Every number should retain its period, unit, product boundary and evidence label through analysis and publication.
4. Industry Cycle and Demand Transmission
4.1 The transmission chain
The core cycle is:
end-market orders → part schedules → machine utilization → cutting time → edge wear → user inventory drawdown → distributor replenishment → tool-factory orders
Every arrow can introduce a delay. An aircraft order may take years to become component output. A machine-tool order may precede tool consumption by design, build, shipping, installation and process-qualification time. A rise in production can initially consume tools already held by the user. A distributor can then amplify the cycle by restocking quickly or postpone orders by reducing safety inventory.
4.2 Cyclical and structural demand
Cyclical demand includes factory utilization, capital spending, short-term vehicle schedules, distributor stock and manufacturing new orders. It is reversible. Structural demand changes the amount or value of tooling per accepted part: difficult materials, tighter feature requirements, automation, fewer manual corrections, combination processes, traceability and regional supply qualification.
The two can move in opposite directions. A weak production cycle can coexist with rising demand for a specialized aerospace tool. A strong vehicle market can coexist with falling tool spend if a new process reduces machining content, consolidates operations or extends tool life.
4.3 Tool-demand elasticity
Cutting-tool demand rarely moves one-for-one with manufacturing output. The elasticity depends on five counteracting effects:
- Higher output and machine utilization generally increase edge consumption.
- Higher load, difficult material or aggressive cycle targets may increase wear faster than output.
- Process improvement may reduce tools per part while increasing the value of each tool.
- Longer-life tools reduce purchase frequency but may increase supplier revenue if the price and customer value rise sufficiently.
- Regrinding shifts demand from new tools to service and can smooth replacement cycles.
The correct KPI is therefore not “tools sold per factory.” It is a linked set: accepted parts, cutting hours, tools or edges consumed, realized price, regrind share and cost per accepted part.
A plant-level model for estimation, cycle time and cost per accepted part is in the CNC machining cost guide.
4.4 Inventory cycle
Three inventories must be separated:
1. Manufacturer inventory: raw materials, work in process and finished tools.
2. Distributor inventory: standard stock, project stock and slow-moving SKUs.
3. End-user inventory: line-side stock, crib stock, safety stock and tools waiting for regrind.
A tungsten price shock can create buy-ahead at all three levels. Kennametal stated that part of its fiscal Q2 growth came from customer buy-ahead related to tungsten pricing.[4] That improves current shipments but can reduce future orders when customers work through inventory. Custom tools are less exposed to generic distributor destocking, but they can create customer-specific inventory that is harder to redeploy.
4.5 Leading-indicator dashboard
| Indicator | Typical lead | What it can signal | Main limitation |
|---|---|---|---|
| Manufacturing new orders | 3–6 months | Broad activity direction | Does not identify machining content |
| Machine-tool orders | 6–12+ months | Future capacity and confidence | Installation and utilization lag |
| Vehicle production schedules | 1–3 months | Automotive cutting load | Model and material mix matter |
| Aircraft deliveries and supplier schedules | 3–12 months | Aerospace production conversion | Bottlenecks may sit outside machining |
| Distributor inventory | 1–3 months | Replenishment or destocking | Often unavailable publicly |
| Tungsten and cobalt prices | 1–6 months | Quotation and working-capital pressure | Contract lags vary |
| Cutting-tool shipment value and units | Current/synchronous | Actual channel activity | Price and inventory can distort consumption |
| Region | Current activity | Leading / capacity | Data comparability | Evidence behind the score |
|---|---|---|---|---|
| United States | 4 | 3 | 5 | Shipment value was strong, while unit direction was mixed; the recurring AMT/USCTI series provides relatively high visibility.[1] |
| Europe | 2 | 4 | 4 | 2025 machine-tool production was weak, but German H1 2026 orders improved.[2][3] |
| China | 4 | 3 | 4 | Equipment and high-technology manufacturing expanded, while utilization and downstream conditions remained mixed.[12] |
| Japan | 3 | 3 | 3 | January orders rose strongly year on year but fell month on month; the signal is useful but volatile.[13] |
| India / ASEAN | 3 | 4 | 2 | India manufacturing grew in April 2026, while ASEAN region-wide manufacturing data lagged the current cycle.[14][15] |
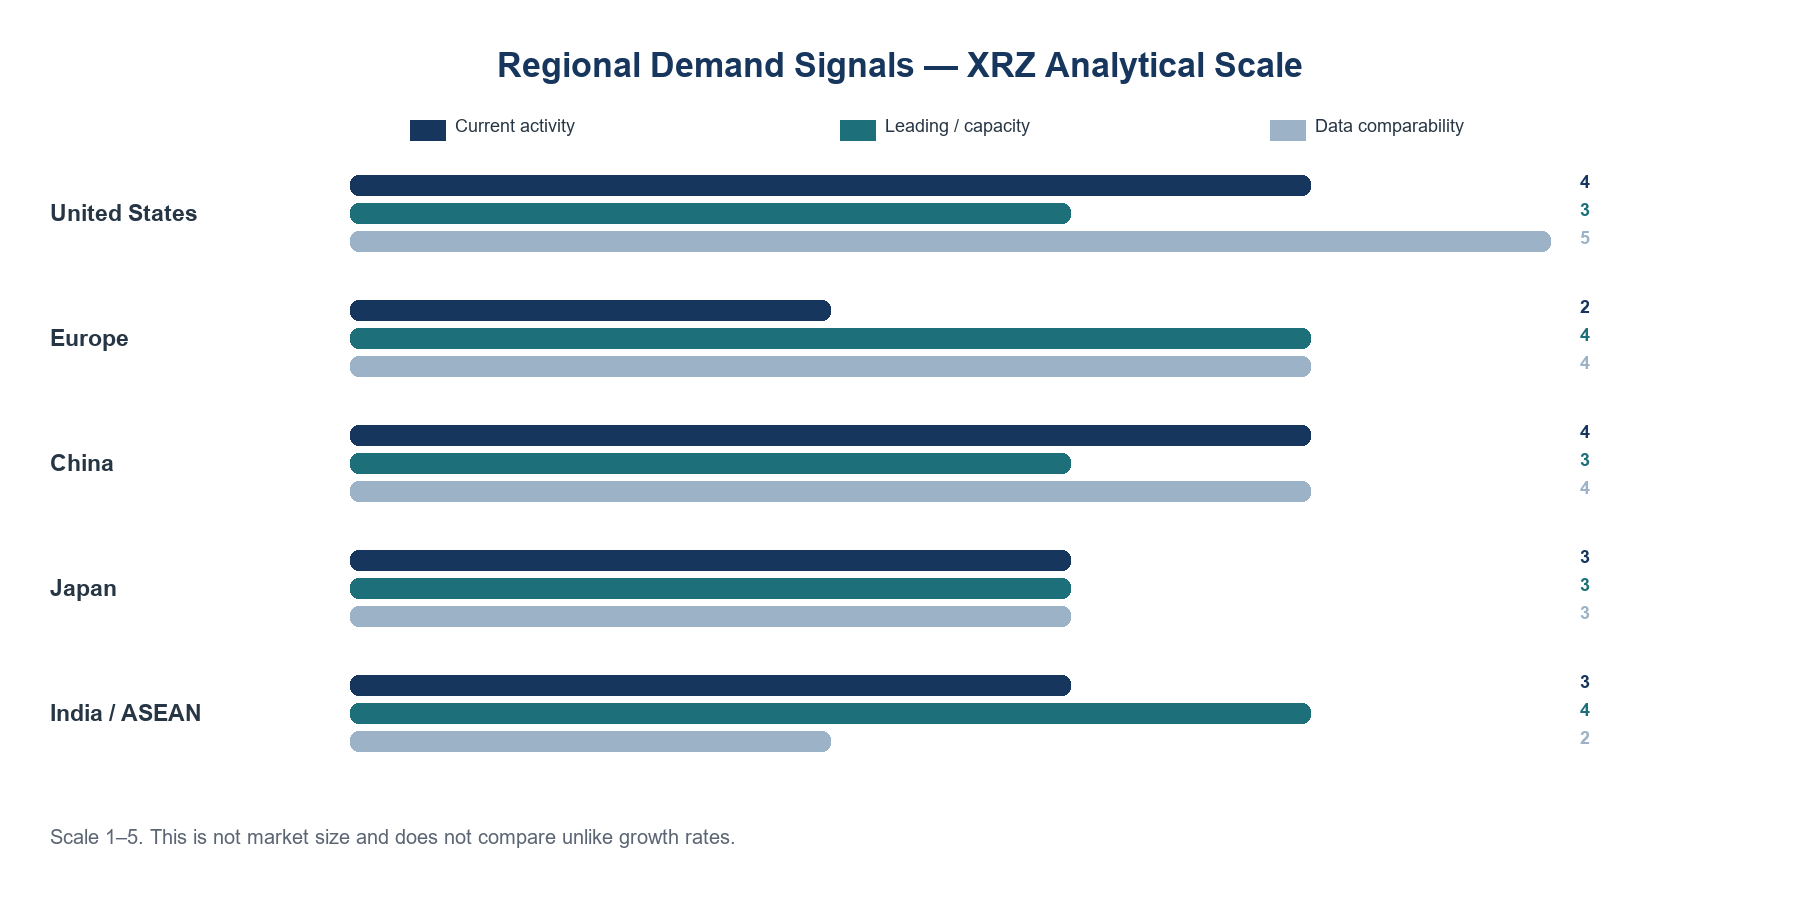
Section judgment: 2026 is best described as an early, uneven recovery with a strong nominal-price component. A sustained upcycle requires shipment units, machine utilization and end-market conversion to confirm the current revenue signal.
5. Regional Market Analysis
5.1 North America
North America has the strongest direct cutting-tool shipment evidence in this report. U.S. shipments improved from $2.56 billion in 2025 to double-digit year-on-year growth through July 2026. The July value of $278.1 million was 29% above July 2025. Because units were steady month on month, the data indicate a mixture of real demand, price and mix rather than a pure unit boom.
The attractive demand pockets are aerospace and defense, selected energy applications, medical, automated general engineering and the North American automotive chain, including Mexico. The constraints are tariff and material-price uncertainty, customer inventory, heavy-truck softness in some periods and the need for fast local support.
For HENTRY, the region is commercially relevant where a distributor or end user can define the material, feature, machine, current failure and annual volume. The strongest entry route is not a broad “lower-price alternative.” It is a controlled engineering proposition: a drawing-based holemaking or special-tool review, measurable sample plan, revision control and a reliable repeat-supply route.
5.2 Europe
Europe entered 2026 from a weaker base. CECIMO estimated 2025 machine-tool production at €23.5 billion, down 6.6%, with Europe’s share of world production at 30.8%. Germany then reported H1 2026 orders up 14%, led by aerospace and defense, while production and the domestic market still lagged.
This creates a two-speed market. Aerospace-oriented France, the UK and parts of Germany can be strong while automotive and general engineering remain pressured. Italy’s machine-tool and SME base values responsiveness and application support. Central and Eastern Europe remain important for automotive components but are exposed to platform and powertrain shifts.
European buyers are likely to demand clear technical files, consistent batches, regrinding logic and change control. Price remains important, but the supplier must account for documentation, local inventory and service cost. An export quote that ignores these costs can win revenue and lose margin.
5.3 China
China’s H1 2026 manufacturing value added grew 5.5% year on year. In the first seven months, equipment manufacturing grew 9.7% and high-tech manufacturing 13.8%. June output data showed strong growth in general machinery, special machinery, automotive and transport-equipment manufacturing. China is therefore not a simple low-growth market.
The challenge is commercialization. Domestic suppliers continue to improve, standard-tool competition is intense and large customers can demand fast iteration and price reductions. A supplier must distinguish activity growth from obtainable margin. For HENTRY, domestic evidence in aluminum precision holes, custom combination tools and hard-to-standardize applications is more defensible than competing across the entire standard catalog.
5.4 Japan and South Korea
FACT: Japan’s machine-tool order series showed January 2026 orders of ¥145.58 billion, up 25.3% year on year, with overseas demand supporting the increase.[13] The monthly series remained available through August at this report’s cut-off. Machine-tool orders are a leading indicator of future capacity use, not a direct measure of cutting-tool consumption.
INDUSTRY INFERENCE: Japan and South Korea combine automotive, electronics, machinery and mature domestic tooling competitors. Entry usually requires consistent batches, complete documentation and long-term supply confidence. An external supplier has the clearest opening where a drawing-defined feature needs a custom geometry, cost redesign, second source or faster engineering response. This report does not assign a numerical 2026 South Korean cutting-tool growth rate because no directly comparable public series was identified for the same product boundary and cut-off date.
5.5 India and Southeast Asia
FACT: India’s revised Index of Industrial Production reported manufacturing growth of 6.2% year on year in April 2026; the statistical agency changed the base year to 2022–23, so the new series should not be spliced casually to the old index.[14] OICA also reported growth in India’s 2025 vehicle production.[8]
FACT: ASEAN’s official statistical portal shows that the latest region-wide manufacturing dataset available at this cut-off is 2024, while the latest quarterly trade series extends into 2026.[15] This timing mismatch limits current, region-wide conclusions.
INDUSTRY INFERENCE: India and Southeast Asia are capacity-growth markets rather than one homogeneous region. Automotive, electronics and supply-chain relocation can create machine and tooling demand, but plant ownership, local engineering, installed machine capability and global-specification control determine which suppliers can convert that growth. Distributor training, application qualification and stock discipline are therefore as important as catalog breadth.
5.6 Comparable regional scorecard
| Region | 2026 demand signal | Product mix | Price sensitivity | Service requirement | HENTRY entry implication |
|---|---|---|---|---|---|
| North America | Improving; shipment value strong | Aerospace, automotive, energy, medical | Medium | High | Enter through application and distributor support |
| Europe | Fragile recovery; aerospace stronger | High-value, documented and application-specific | Medium | Very high | Documentation and repeatability are gating factors |
| China | Strong equipment/high-tech output; mixed utilization | Broad, rapidly upgrading | High | High and fast | Focus on differentiated applications and evidence |
| Japan/South Korea | Mature and selective | Precision, automotive, electronics | Medium | Very high | Target gaps, not broad catalog substitution |
| India/SE Asia | Capacity and supply-chain growth | Automotive, electronics, general engineering | Medium-high | Uneven | Build capable channels and qualification support |
Scoring method for Figure 2. Scores indicate the strength and direction of the latest available demand signals, not absolute market size. A score of 1 represents broad contraction or weak visibility; 3 represents mixed or neutral conditions; and 5 represents broad-based expansion supported by at least two independent indicators. Current activity, leading/capacity signals and data comparability are scored separately; they are not averaged into a hidden composite. Different reference periods are disclosed rather than normalized into a false like-for-like growth rate.
Evidence note for the regional scorecard. This is a qualitative HENTRY analytical comparison, not a market-size ranking. Sources: AMT/USCTI, CECIMO, VDW, China NBS, JMTBA, India MoSPI and ASEANstats.[1]–[3][12]–[15] Last updated 13 October 2026.
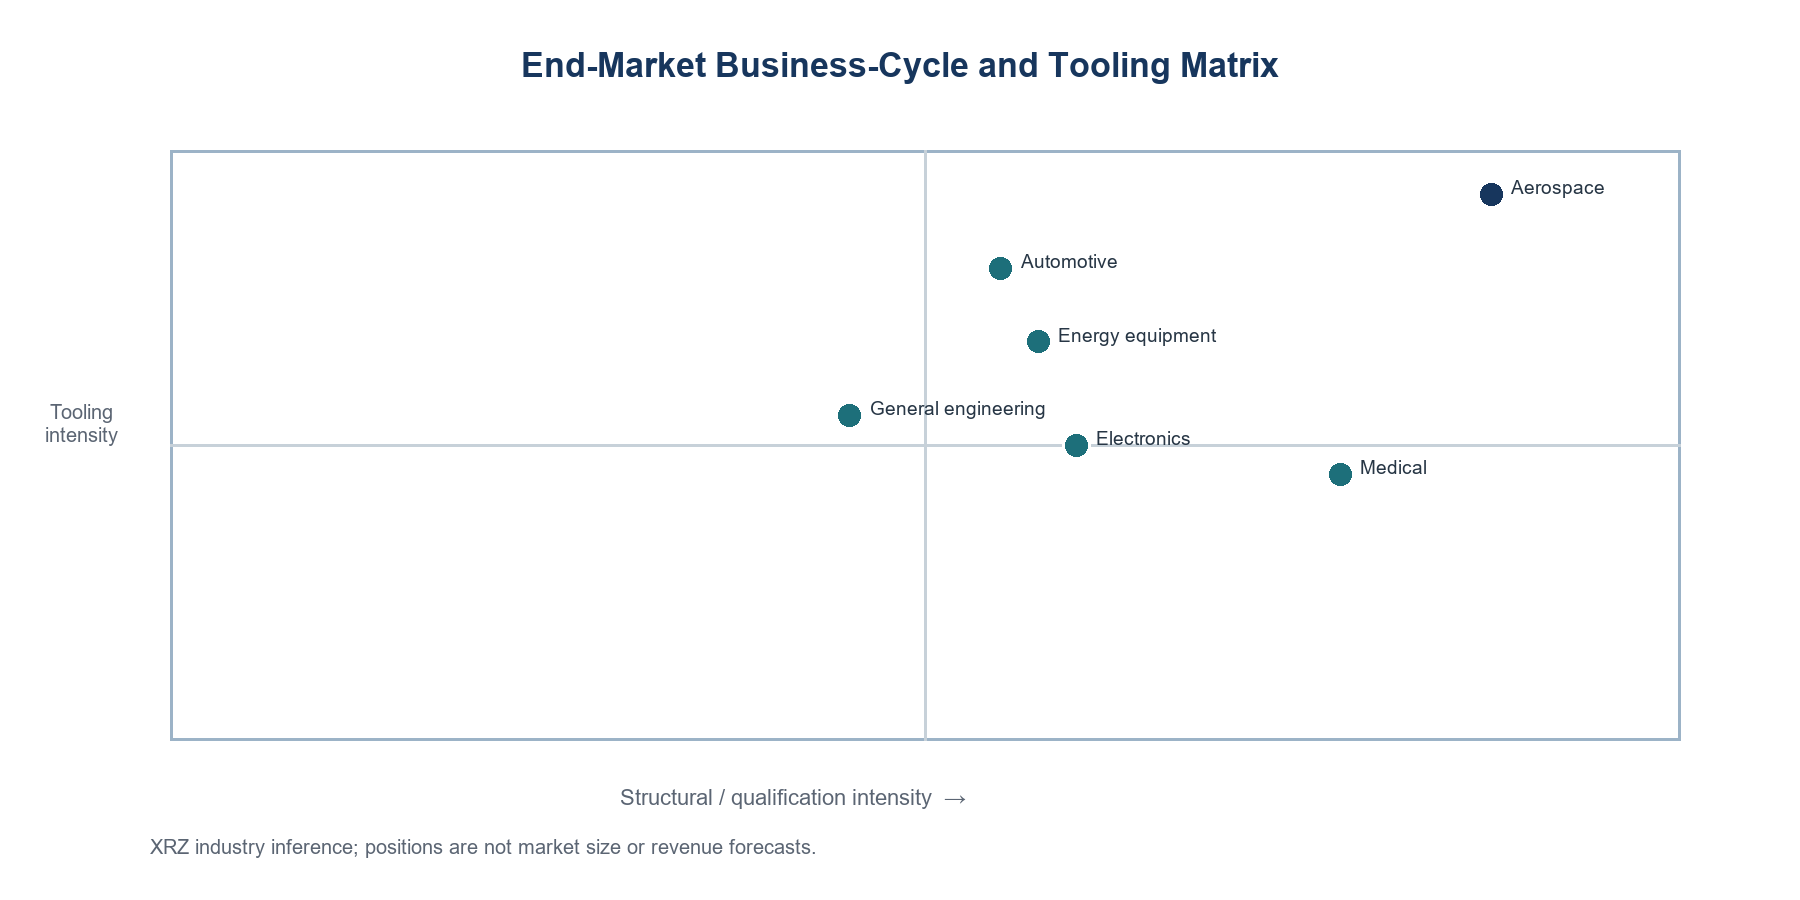
Section judgment: no region should be ranked by GDP or manufacturing growth alone. Entry priority is the product of demand, tooling intensity, technical fit, accessible channels and the cost of service.
6. Aerospace and Defense
6.1 Demand conversion
Airbus reported 547 aircraft deliveries through September 2026 and 72 deliveries in September.[5] Its H1 results fixed the commercial-aircraft backlog at 9,222 on 30 June.[6] Boeing reported Q2 Commercial Airplanes deliveries of 171 and a backlog exceeding 6,200 aircraft.[7] These are strong multi-year demand signals, but the cutting-tool transmission is not immediate:
backlog → production schedule → supplier capacity → forged/cast/composite input → rough machining → precision features → assembly and inspection → delivery
If engines, castings, labor or certification constrain output, backlog can rise while tool consumption grows more slowly. The relevant indicators are supplier production, actual deliveries, engine/MRO activity, utilization of machining assets and the number of qualified part programs.
6.2 Parts, materials and tooling intensity
| Part or feature | Typical material | Machining challenge | Tooling direction to evaluate |
|---|---|---|---|
| Wing and fuselage structures | Aluminum alloys | High material removal, burr and surface requirements | Polished carbide or PCD where the operation is compatible |
| Landing-gear components | High-strength steel and titanium | Heat, force, long reach and interrupted features | Application-specific coated carbide, indexable or PCBN only where appropriate |
| Engine casings | Titanium and nickel alloys | Heat concentration, distortion and tool wear | Rigid systems, heat-resistant grades/coatings and controlled coolant |
| Turbine components | Nickel superalloys | Work hardening and thermal load | Coated carbide, ceramic in suitable operations and controlled edge management |
| Composite panels | CFRP | Delamination, fiber breakout and abrasive wear | Composite geometry, diamond coating or PCD after support and process control |
| Fastener holes and stacks | CFRP/aluminum/titanium stacks | Conflicting cutting mechanisms, interface and exit damage | Stack-specific drill geometry or staged process |
6.3 Economic and investment judgment
Aerospace supports high-value tools because rejected features, machine time and qualification disruptions are expensive. It also creates high supplier-entry costs: documentation, sample validation, traceability, controlled changes and long approval cycles. A tool can be technically good and commercially unattractive if the addressable part volume is small or the customer’s qualification route is too costly.
PCD and diamond-coated tools are credible for CFRP and compatible non-ferrous operations, but not universal aerospace solutions. Titanium, nickel alloys and ferrous materials require separate material and edge-system decisions. A CFRP/metal stack must be treated as a stack, not as a thicker composite.
HENTRY implication: CFRP tools, PCD tools for compatible aluminum structures and drawing-based fastener-hole solutions are potential opportunities. Public claims require actual tool photos, edge/geometry records, application boundaries and sample results. Aerospace market growth alone does not prove HENTRY qualification.
Section judgment: aerospace is the strongest structural demand market in the report, with high tooling intensity and defensible technical premiums. Access probability and evidence, not demand, are the limiting variables.
7. Automotive, Hybrid and Electric Vehicles
7.1 The market is shifting, not simply shrinking
OICA reported global vehicle production of 96.4 million units in 2025, up 3.9% from 2024.[8] Regional performance diverged: Asia-Oceania rose, while Europe and NAFTA declined. EU registrations increased 5.7% in H1 2026; battery-electric vehicles reached a 20.7% share and hybrids 37.3%.[9]
The tooling conclusion is not “EV is good” or “EV eliminates machining.” Battery-electric powertrains remove some engine and transmission parts, while hybrid vehicles retain substantial combustion and transmission content. Every vehicle still requires chassis, steering, braking, thermal-management and structural systems. EVs add aluminum motor and reducer housings, battery trays and power-electronics structures. Large castings may reduce the number of assembled parts while creating new finishing, holemaking and datum-control tasks.
7.2 Part-level machining map
| System | Representative parts | Material context | Tooling tasks |
|---|---|---|---|
| ICE and hybrid engine | Blocks, heads and pump bodies | Cast/wrought aluminum, cast iron, steels | Drilling, boring, reaming, seat and guide features |
| Transmission/reducer | Housings, shafts and gears | Aluminum and steels | Precision holes, faces, bearing seats and gear-related machining |
| Electric drive | Motor and reducer housings | Aluminum alloys | Coaxial bores, bearing seats, sealing faces and threaded holes |
| Battery system | Trays and structural members | Extruded, fabricated or cast aluminum | Milling, drilling, chamfering and burr control |
| Chassis and safety | Knuckles, subframes and brake/steering parts | Aluminum, steel and iron | Drilling, reaming, boring, milling and feature combinations |
| Thermal management | Valve, pump and manifold bodies | Aluminum and stainless steel | Cross holes, sealing bores, threads and deburring |
7.3 Positive and negative demand effects
Negative effects include fewer machined combustion-engine parts per BEV, integrated designs that remove components, and longer tool life that reduces units purchased. Positive effects include growth in aluminum housings, demanding bore relationships, hybrid production, chassis lightweighting, thermal systems and new manufacturing lines.
The net impact depends on the plant and tool family. A supplier concentrated in engine-valve tools faces a different transition from a supplier focused on aluminum housing bores or general carbide drilling.
7.4 HENTRY opportunity
The most relevant applications are PCD finish reaming for compatible aluminum and high-silicon aluminum, precision holemaking in housings, multi-diameter tools, drill–ream–chamfer integration and high-volume wear control. These are hypotheses until matched with evidence:
- Verified capability: only the product and application records already approved by HENTRY.
- Adjacent inference: geometry or manufacturing capability exists, but the exact part/material has not been validated.
- Unverified: no sample, inspection or repeat-order evidence exists.
The commercial case should use cost per accepted part. A longer-life tool that lowers changeover and scrap can justify a higher purchase price. A custom tool that saves seconds but requires frequent adjustment may not.
Section judgment: automotive tooling demand will become more heterogeneous through 2030. Precision aluminum holemaking remains attractive, but suppliers must map actual parts and powertrain exposure instead of relying on vehicle totals.
8. General Engineering, Energy, Medical and Electronics
8.1 Prioritize by tooling intensity, not industry size
These industries should be compared with a common opportunity model:
Opportunity score = demand times tooling intensity times HENTRY fit times access probability
Each factor should be scored on a defined scale, with zero acting as a genuine gate. A very large market is not attractive if HENTRY lacks the process or channel. A smaller industry can be attractive when the feature repeats, the cost of failure is high and drawing-based tooling creates switching cost.
8.2 General engineering
Pumps, valves, hydraulic bodies, compressors, construction equipment and automation components create recurring drilling, reaming, boring, threading and milling demand. The commercial problem is fragmentation. High-mix, low-volume work may be served best by standard tools because a custom design cannot recover its engineering cost. Custom tools become credible when the same feature repeats, several operations create accumulated error, cycle time is constrained or a standard tool fails predictably.
The strongest HENTRY task is not “general engineering tooling.” It is a narrower problem such as a sealing bore with controlled diameter and surface requirement, a cross-hole sequence with burr risk, or a recurring drill–ream–chamfer operation.
8.3 Energy
FACT: The IEA expects global energy investment to reach about $3.4 trillion in 2026, up 5% from 2025, with clean-energy investment at $2.2 trillion.[18] The same source emphasizes regional and technology differences; spending does not translate one-for-one into machined components.
INDUSTRY INFERENCE: Oil and gas, wind, nuclear, conventional power, LNG, grids and hydrogen equipment can involve large parts, long reach, difficult alloys, deep holes and project-driven schedules. Tool demand may be high per part but volatile. The opportunity favors suppliers with evidence for the exact material, feature, machine and delivery requirement.
8.4 Medical
FACT: FDA recorded 29,178 registered medical-device establishments during FY2025, including 13,328 domestic and 15,850 foreign establishments.[16] Registration is a manufacturing-footprint indicator; it does not prove output growth, purchasing volume or regulatory approval.
INDUSTRY INFERENCE: Medical machining uses titanium, stainless steel, cobalt alloys and polymers across implants, instruments and equipment. Small tools, difficult materials, inspection and traceability can raise tool value, while validation and small-feature process control raise entry cost. A supplier should claim capability only for a verified material, feature and documentation route.
8.5 Electronics
FACT: The Semiconductor Industry Association reported 2025 global semiconductor sales of $791.7 billion, up 25.6% from 2024.[17] That is a semiconductor-revenue measure, not a cutting-tool market measure.
INDUSTRY INFERENCE: Semiconductor equipment, connectors, thermal components and general precision electronics can create demand for small tools, aluminum and copper machining, high spindle speeds and burr control. Mass electronics and semiconductor-equipment components do not share one machining profile. Tool opportunity depends on the machined part set, not chip sales alone.
8.6 Priority judgment
| Segment | Demand | Tooling intensity | Likely HENTRY fit | Access difficulty | Priority interpretation |
|---|---|---|---|---|---|
| Hydraulic/valve precision holes | Medium | High | High for holemaking | Medium | Priority application cluster |
| Compressor and pump bodies | Medium | Medium-high | Medium-high | Medium | Drawing-based target |
| Energy difficult-material parts | Cyclical | High | To be verified | High | Selective project pursuit |
| Medical precision parts | Structural | Medium-high | To be verified | High | Evidence-first development |
| Electronics micro-tools | Structural | High volume | To be verified | High | Do not enter on market size alone |
Section judgment: the best adjacent market is the one with repeatable machining economics and reachable qualification, not necessarily the fastest-growing end market.
9. Cutting-Tool Product-Mix Shift
9.1 Indexable versus solid round
Indexable tools separate a reusable body from replaceable cutting items. They can reduce replacement cost at larger diameters and heavy cutting loads, and simplify edge changes. Solid round tools can provide continuous geometry, small diameters, flute forms and concentricity suitable for drilling, reaming and end milling. Neither route is universally cheaper.
The decision variables are diameter, feature tolerance, edge count, cutting load, runout, flute and coolant geometry, regrind route, machine capacity and inventory. An indexable drill may be attractive for a large hole but unable to meet a finish or geometry requirement without a secondary process. A solid drill may make the feature in one tool but carry a higher replacement cost if damaged.
9.2 Standard versus custom
Use standard tooling when dimensions are common, tolerance is moderate, production is low or uncertain, the process is mature and separate operations are acceptable. Evaluate a custom tool when one or more of the following are measured:
- a special diameter, step or form is required;
- multiple operations create datum or accumulated-error problems;
- tool changes limit cycle time or unattended production;
- annual volume can amortize design, sample and setup cost;
- the same standard-tool failure repeats after setup variables are controlled;
- a combination can share speed, feed, coolant, chip path and wear logic.
The standard-versus-custom decision should include an exit route. If a custom tool fails validation, can the process return to standard tools? If a custom supplier cannot deliver, can another supplier reproduce the revision and inspection method?
9.3 Premiumization: test the claim
Premiumization exists only when price is linked to measurable value. Useful evidence includes accepted parts per edge, reduced cycle time, fewer tool changes, lower scrap, fewer inspection interventions, improved feature capability under a defined method, or a qualification/documentation package that reduces customer risk.
Higher life alone does not guarantee higher supplier revenue. A tool lasting twice as long may halve purchase frequency. Revenue grows only if the realized price, market share, service revenue or customer retention offsets lower unit replacement. The customer’s economic benefit and the supplier’s revenue benefit are related but not identical.
9.4 Product mix and margin
High-end and custom products can support price, but they also create costs: application engineers, programming, low-volume setup, blanks, special inspection, sample tools, revisions and slow inventory. Margin improves when designs repeat across a controlled family, sample conversion is high, regrinding is recoverable and changes are billed or managed. Margin deteriorates when every inquiry becomes unpaid engineering or when one-off tools occupy bottleneck equipment.
Section judgment: product mix improves earnings quality only when technical differentiation is repeatable and engineering cost is measured. A custom-tool revenue share without engineering-hour and conversion data can be misleading.
10. Carbide, PCD and PCBN Technology Economics
10.1 Cemented carbide
Cemented carbide performance depends on tungsten-carbide grain structure, binder content, substrate quality, geometry, coating and edge preparation. Hardness and wear resistance must be balanced with toughness. A fine-grain substrate and hard coating do not compensate for poor flute form, excessive runout or chip packing.
Carbide remains the broadest cutting-material platform because it supports complex solid-tool geometry and a wide material range. Its 2026 economic risk is tungsten. USGS estimated that China produced 67,000 metric tons of tungsten in 2025 out of a world total of 85,000 metric tons. It also reported new Chinese export controls and a sharp rise in tungsten concentrate and APT prices through 2025. That concentration makes rod, insert and finished-tool pricing sensitive to policy, inventory and recycling.
10.2 PCD
Polycrystalline diamond (PCD) is a tool material for compatible non-ferrous and abrasive applications, including many aluminum, composite and non-metallic tasks. Its economics depend on PCD grade and grain structure, cutting-edge preparation, segment arrangement, brazing or other joining method, body precision, guide/support design, achievable geometry and reconditioning.
PCD should not be described as a universal “long-life” material. It is usually unsuitable for conventional ferrous machining conditions because chemical and thermal interactions can accelerate wear. Its higher acquisition price is justified when wear-related losses, tool changes, scrap or a drawing requirement create sufficient value. Small diameters or complex forms may favor diamond-coated carbide or another construction.
10.3 PCBN
Polycrystalline cubic boron nitride (PCBN) is mainly evaluated for hardened ferrous materials and selected cast-iron operations. CBN content, binder, edge preparation, interruption and thermal conditions change performance. Continuous hard turning and interrupted cutting do not share the same grade requirement.
PCBN is not the counterpart to PCD in every application. The workpiece hardness, microstructure, interruption, stock allowance, rigidity and surface requirement must be defined before grade selection.
10.4 Lifecycle economics
| Comparison | What must be held comparable | Decision measure |
|---|---|---|
| PCD vs carbide | Part, material, feature, machine, support and inspection | Cost per accepted feature and quality drift |
| Coated vs uncoated carbide | Substrate/geometry where possible, coating state and regrind route | Accepted output before defined wear limit |
| New vs reground | Revision, recovered geometry, coating and inspection | Recovery yield, performance distribution and turnaround |
| Standard vs combination | Feature set, datum chain, cycle and failure criteria | Accepted-part cost plus changeover and engineering cost |
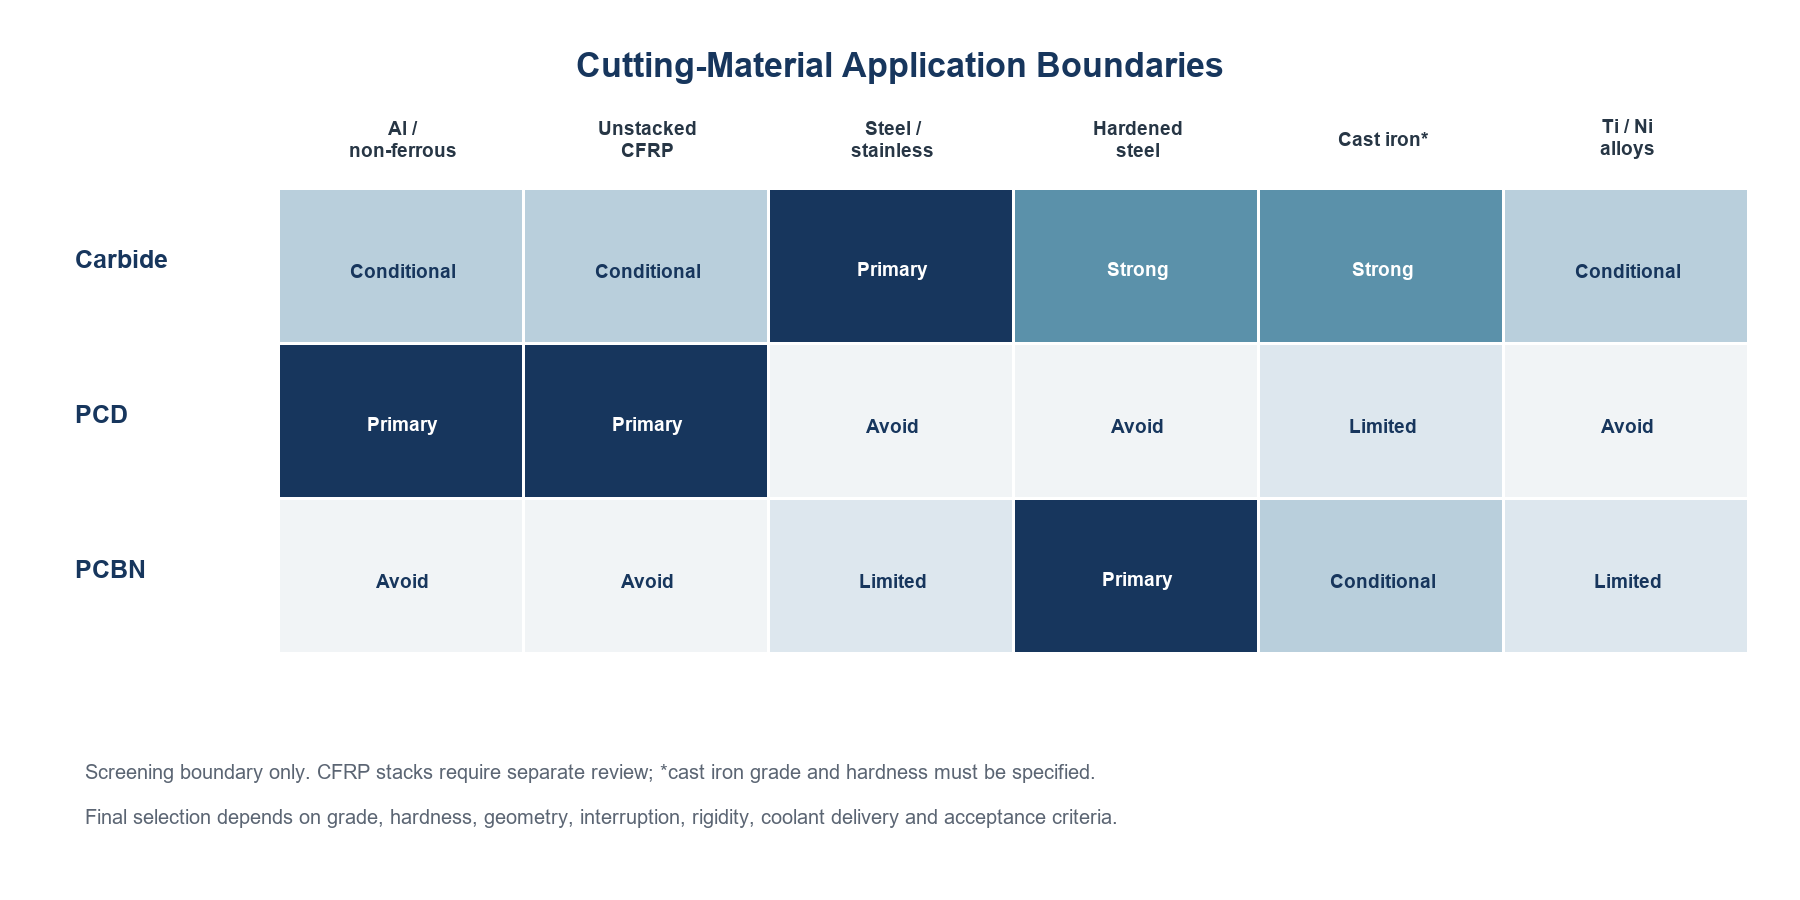
The value model should be monetary and based on accepted output:
Cost per accepted feature = (Tool purchase cost + reconditioning cost + change labor + downtime + inspection + scrap/rework cost) ÷ accepted holes, parts, or cutting length
Convert time into cost using documented machine and labor rates. Do not add minutes directly to currency. Compare complete systems under equivalent acceptance criteria.
Final tool-material selection depends on workpiece grade, hardness, hole geometry, interruption, machine rigidity, coolant delivery and acceptance criteria. In Figure 4, CFRP means unstacked CFRP only; CFRP/aluminum and CFRP/titanium stacks require stack-specific review. Cast iron is a screening category that must be separated into gray, ductile and hardened grades before selection. PCBN suitability depends on hardness, cutting continuity and stock allowance, while carbide use in titanium and nickel alloys remains grade-, coating-, geometry- and coolant-dependent.
For application-specific routes, review PCD reamers for non-ferrous precision holes, solid carbide drills and PCD tools for CFRP machining.
Section judgment: cutting material is one economic variable inside a tool system. The correct choice is the route that protects accepted output at the lowest controlled lifecycle cost, not the route with the longest isolated tool life.
11. Coatings, Coolant and Chip Control
11.1 Coating selection is application-specific
TiN, TiCN, TiAlN, AlCrN, DLC, diamond coating and uncoated polished carbide solve different friction, temperature, adhesion and wear problems. A coating comparison without substrate, edge preparation, workpiece and cutting conditions is not decision-grade.
For example, a heat-resistant coating can support dry or high-temperature cutting in a suitable steel application, but coating thickness and edge rounding may be harmful to a sharp small tool. DLC or polished uncoated carbide may help manage adhesion in compatible aluminum operations. Diamond coating can add abrasive-wear resistance to complex carbide geometry, but coating integrity and edge rounding must be evaluated.
11.2 Coating metrics
Coating decisions should record wear resistance, oxidation limit where relevant, friction/adhesion behavior, thickness, edge radius before and after coating, adhesion failure, substrate compatibility and the recoat route. “Coated” is not a performance specification.
11.3 Coolant and chip evacuation
Dry cutting, flood coolant, minimum-quantity lubrication (MQL) and through-coolant systems change heat removal, lubrication and chip transport. The key variables are hole depth, diameter, flute volume, chip form, coolant outlet, pressure and flow at the tool, return path, peck cycle and material tendency to adhere or work harden.
Coolant pressure alone is not enough. A nominal pressure at the pump does not prove usable flow at the cutting edge. A small outlet can create velocity but restrict flow; a large outlet can reduce velocity. The machine, holder and tool form one delivery system.
11.4 Diagnostic sequence
| Failure | First measurements | Then inspect | Do not assume |
|---|---|---|---|
| Drill breakage | Assembled runout, break location and hole depth | Chip packing, feed, rigidity, coolant and pre-hole | Coating is the primary cause |
| Oversized hole | Entry/exit diameter, runout and edge symmetry | Spindle/holder, point geometry and wear | Nominal drill diameter explains the hole |
| Chip packing | Chip form, flute loading and coolant delivery | Hole depth, peck, feed and material condition | More pressure always solves evacuation |
| Reamer chatter | Allowance, runout and bore condition | Guidance, overhang, fixture and flute arrangement | Reaming will correct an unstable pre-hole |
| Poor surface | Defect location and edge deposit/wear | Allowance, built-up edge, coolant and speed/feed relationship | A harder grade alone will improve finish |
The one-variable rule is practical: contain immediate safety and setup problems, establish a baseline, change one decision variable or compare two fully documented systems, and inspect against the same acceptance method.
Section judgment: coating and coolant are parts of a causal system. Failure diagnosis should begin with the observable defect and its timing, not with a catalog grade change.
12. Digitalization and Intelligent Tooling
12.1 Tool data as a deliverable
ISO 13399[20] provides a system-independent structure for representing cutting tools, cutting items, assemblies, adapters and their relationships. The business implication is larger than file-format compliance: customers increasingly expect the physical tool to arrive with structured identity, geometry, 2D/3D representation, cutting data, revision and inspection information.
The newer Cutting Tool Definition initiative[21] and MTConnect models[22] distinguish static catalog geometry from actual measured and process data. That distinction matters. A nominal tool model supports planning; a measured assembly length, diameter, offset and wear state support production control.
12.2 Wear monitoring
Wear monitoring ranges from laboratory research to production systems. Direct methods observe the edge with vision or metrology. Indirect methods infer state from spindle load, power, vibration, acoustic emission, temperature or part measurements.
An algorithm is useful only if it produces a reliable action: continue, inspect, compensate, regrind or change. It must control false alarms, sensor drift, material and batch changes, machine differences and changes in tool geometry. A laboratory model trained on one operation is not automatically transferable to another plant.
12.3 Economic value
Digitalization can reduce unplanned stoppage, avoid premature changes, support unattended machining, speed CAM and presetting, improve traceability and create a regrind history. The value should be measured through stopped-machine minutes, unexpected breakage, unused remaining life, setup time, data errors and accepted parts.
For small and medium plants, deployment cost and data discipline can exceed the benefit. A practical sequence is:
1. unique tool ID and revision;
2. controlled drawing and inspection record;
3. usable 3D model and assembly data;
4. baseline life/change criteria;
5. machine/process data where the action justifies collection;
6. predictive logic only after the data are reliable.
12.4 Supplier implication
Future cutting-tool supply increasingly includes the tool, parameter guidance, model, identification, inspection record, revision and service history. This favors suppliers that manage engineering data as carefully as grinding and brazing.
HENTRY implication: begin with stable naming, drawing revision, inspection fields and application inputs. Do not market “AI tooling” until a customer workflow, data source, prediction target and verified action exist.
Section judgment: digital tool data is commercialized today; autonomous wear prediction remains application-dependent. The near-term opportunity is reliable data exchange and traceability, not broad AI claims.
13. Raw Materials and Supply-Chain Economics
13.1 Tungsten chain
The carbide chain runs from ore and concentrate through ammonium paratungstate (APT), tungsten powder, tungsten-carbide powder, rod or insert blanks and finished tools. Delay or price escalation at an upstream stage transmits unevenly depending on supplier inventory, contract terms and recycling.
The USGS 2026 tungsten summary reported that China remained the leading producer, importer and consumer of tungsten concentrate in 2025. It estimated Chinese mine production at 67,000 metric tons against an 85,000-metric-ton world total. It also recorded Chinese export controls introduced in February 2025 and a rise in Rotterdam APT prices from $331 to $675 per metric ton unit during 2025.
The financial transmission is:
material price/availability → rod and blank cost → inventory value → quotation change → customer acceptance lag → gross-margin pressure → cash tied up
13.2 Cobalt and binder risk

FACT: USGS identified cobalt as a concentrated supply chain in its 2026 Mineral Commodity Summary and publishes separate production, trade and price monitoring for the material.[19] Cobalt is used in cemented-carbide binders as well as batteries and other applications.
INDUSTRY INFERENCE: binder substitution is constrained by grade toughness, sintering response and qualified performance. A supplier should monitor both price and availability rather than treating cobalt only as a minor percentage of tool mass. Any substrate change requires a controlled technical review.
13.3 PCD, PCBN and coating capacity
PCD and PCBN supply risk includes grade availability, blank or segment dimensions, supplier concentration, lead time and qualification cost for a replacement grade. A new blank is not interchangeable merely because its product category matches. Edge quality, binder, grain structure and joining response may differ.
Coating economics depend on captive versus outsourced capacity, batch minimums, transport, queue time, masking, stripping/recoating and recovery after regrind. Outsourcing reduces capital intensity but can extend lead time and weaken schedule control.
13.4 Recycling and resilience
Mitsubishi Materials reported a 58.6% recycled-tungsten ratio for the fiscal year ended March 2025[25] and has continued to invest in recycling. The company’s acquisition of H.C. Starck also shows that upstream material and recycling capability can be a strategic moat.
For a smaller tool manufacturer, the practical equivalents are carbide-scrap segregation, recoverable regrind programs, multiple qualified raw-material routes where technically possible, quotation validity and inventory limits by risk class.
13.5 Dashboard
Track APT and cobalt prices, carbide-rod quotes, PCD/PCBN lead times, inventory days, supplier concentration, prepaid material, quote validity, price acceptance, gross margin by product family, slow stock and cash conversion.
Section judgment: raw-material volatility affects price, mix, inventory and cash simultaneously. The right response is not indiscriminate stockpiling; it is segmented inventory, shorter quote validity, technical substitution control and recycling.
14. Manufacturing Capacity and Capital Intensity
14.1 Equipment map
Cutting-tool capacity can involve CNC tool grinding, electrical-discharge machining, laser processing, brazing, coating, edge preparation, cylindrical grinding, presetting and optical/dimensional inspection. The required route depends on tool family. A solid carbide drill, brazed PCD reamer and indexable cutter do not share the same bottleneck.
14.2 Equipment does not equal capability
A machine list is evidence of installed assets, not evidence of a tolerance, batch capability or delivery promise. Capability requires a controlled material and process route, trained operators, programs and fixtures, inspection correlation, revision control, maintenance and a record across repeated production.
The minimum capacity dataset is:
- machine count and relevant process envelope;
- demonstrated cycle time by tool family;
- setup/changeover time;
- utilization and planned maintenance;
- work in process and queue time;
- first-pass yield, rework and scrap;
- outsourced stages and transport time;
- inspection capacity;
- lead-time distribution rather than one target date;
- bottleneck by product family.
14.3 Capex decision
Capital expenditure can replace old equipment, add volume, unlock a geometry, reduce labor, improve inspection or internalize an outsourced stage. Only some of these create sellable capacity. The investment case should state:
Incremental return = (Incremental contribution − added operating cost − working-capital cost) ÷ equipment, tooling, training, and qualification investment
The numerator must use attainable volume, not theoretical machine hours. A high-end machine assigned to one-off samples can reduce responsiveness at the production bottleneck. Automation can lower labor dependence but requires stable product families and reliable material flow.
14.4 HENTRY implication
Capacity claims should be family-specific: which carbide drills, PCD tools or combination forms can be produced; which features are inspected; what is outsourced; and how repeat orders are controlled. The evidence should include actual tools, process images, inspection outputs and revision records. Do not infer capability from an equipment brand alone.
Section judgment: the economically scarce resource is controlled bottleneck capacity, not total machine count. Capex creates value when it raises accepted throughput or unlocks a profitable, repeatable product family.
15. Competitive Landscape and Moats
15.1 Six competitor types
The market is better understood by business model than by one global ranking:
1. Global diversified groups — broad product ranges, direct sales, application teams, digital data and regrind networks.
2. Superhard-tool specialists — deep PCD, PCBN or diamond process knowledge and application focus.
3. Solid-carbide specialists — round-tool geometry, coating and high-volume manufacturing.
4. Custom-tool manufacturers — drawing-based designs, rapid iteration and local engineering.
5. Regional distributors and technical service firms — customer access, stock, field support and multiple brands.
6. Low-cost standard-product suppliers — catalog availability and price, with variable technical depth.
These groups compete differently. A custom manufacturer does not need the SKU breadth of a global group, but it must be faster and more credible on the selected application. A distributor may own the relationship without owning production. A low-cost producer may win standard demand but struggle where qualification and failure cost dominate.
15.2 Eight defensible moats
| Moat | What proves it | Why it matters |
|---|---|---|
| Material technology | Controlled grades, supplier qualification and wear evidence | Enables a repeatable edge system |
| Geometry design | Drawings, revision history and application results | Links the tool to the feature and failure mode |
| Manufacturing control | Process capability and batch inspection | Protects repeat supply |
| Application database | Comparable trials with conditions and outcomes | Reduces design and troubleshooting time |
| Customer qualification | Approved tools and documented changes | Raises switching cost |
| Channel and local support | Stock, response, technical coverage and protected accounts | Converts products into usable supply |
| Regrind network | Recovery yield, turnaround and revision control | Extends lifecycle relationship |
| Digital/technical service | Models, tool data, inspection and integration | Reduces adoption and operating friction |
Equipment and website content can be copied faster than qualification history, repeatable application data and a service network. A decision table or RFQ process is useful but is not, by itself, a durable moat.
15.3 Comparable company analysis
A company table should record revenue, organic growth, product and end-market mix, margin, R&D, capital spending, acquisitions, regional exposure, channel, raw-material exposure and outlook. Where the company does not report a cutting-tool segment, use N/A rather than estimating.
Public disclosures illustrate why normalization matters:
- Sandvik reported Q2 2026 group organic revenue growth of 23% and a 22.6% adjusted EBITA margin[23], but group results are not a pure cutting-tool measure and must be decomposed before comparison.
- Kennametal reported $2.4 billion FY2026 revenue and strong Q4 growth[11], with pricing and tungsten cited as major factors. Metal Cutting segment data should be used for tool-specific analysis.
- Mitsubishi Materials reported ¥234.7 billion for FY2026 Metalworking Solutions[24], but acquisition effects and tungsten products changed the scope.
The correct comparison therefore separates organic volume, price/mix, foreign exchange and acquisitions. Margin should be compared only after segment scope, restructuring and raw-material pass-through are understood.
15.4 HENTRY competitive position
HENTRY should not attempt to reproduce every moat simultaneously. A credible sequence is:
1. build evidence around precision holemaking, PCD tools, solid carbide drills and combination tools;
2. make drawing review, sample validation and revision control visible;
3. connect each claimed application to an actual tool, inspection or approved case;
4. support distributors with protected project handling and usable technical files;
5. add regrinding and lifecycle records only where the service scope is confirmed;
6. standardize digital tool data for repeat products.
Section judgment: the strongest moat for a focused supplier is accumulated application evidence connected to repeatable manufacturing and channel access. Broad catalog language without evidence creates search visibility but little pricing power.
16. Business Models and Quality of Earnings
16.1 Revenue models
Cutting-tool revenue can come from standard stock, custom tools, project sales, distribution, private label, tool management, regrinding and engineering service. Each model has a different cash and margin profile.
Standard stock can produce repeat orders but ties cash to inventory and exposes the supplier to price comparison. Custom tools can support differentiation but consume engineering capacity and create customer-specific stock. Distribution reduces the manufacturer’s cost of access but shares margin and can obscure end-user data. Private label can build volume but increases dependency on a channel customer. Regrinding can improve retention, although logistics and recovery yield determine profitability.
16.2 Earnings-quality indicators
Track:
- repeat-order share by product family;
- sample-to-production conversion;
- revenue from regrind or lifecycle service;
- customer, region and end-market concentration;
- cancellations and schedule changes;
- new-product revenue with a consistent definition;
- price versus volume contribution;
- gross margin after application engineering;
- inventory and receivable days;
- cash conversion;
- warranty, rework and field-failure cost.
Revenue generated by a price increase can be high quality if it protects margin without damaging retention. Revenue created by customer buy-ahead can be low quality if it reverses next quarter. A large custom order can be attractive, but less so if the design is unlikely to repeat or requires inventory that cannot be reused.
16.3 Margin bridge
Gross margin can be represented as:
Δ Gross margin = Price/mix − materials − labor − scrap/rework − outsourcing + utilization effect + productivity ± FX
This bridge should be built by product family. A group-level margin can improve while a special-tool family loses money due to setup and sample cost. Conversely, a service business can have modest revenue and high strategic value through retention and future new-tool sales.
16.4 Distributor economics
Distributors balance gross margin, inventory turns, technical cost, exclusivity, customer protection, private-label value, minimum order, stockout risk and slow-moving SKUs. A supplier program should define:
- which products are stock items and which are drawing-based;
- project-registration and customer-protection rules;
- technical-response responsibilities;
- sample and failure-review workflow;
- minimum economic order and replenishment logic;
- private-label documentation and change control;
- obsolete and slow-stock treatment.
Section judgment: high-quality earnings come from repeat, technically defensible revenue with controlled working capital and low failure cost. Revenue growth without conversion, margin and cash data is incomplete.
17. How Cutting-Tool Buying Criteria Are Changing
17.1 Unit price is an incomplete decision
The purchasing comparison should use cost per accepted part:
Cost per accepted part = (T + S + D + M + Q + R) ÷ Nₐ
where:
- T = tool purchase cost;
- S = tool-change and setting cost;
- D = downtime cost;
- M = machine processing cost attributable to the operation;
- Q = inspection, scrap and rework cost;
- R = regrinding, coating and logistics cost;
- Nₐ = accepted parts.
This is a currency equation. Machine and labor minutes must be converted using documented rates. The comparison must use accepted parts, not total cycles, because a tool that produces rejects near the end of life can appear cheaper if only nominal life is counted.
17.2 Supplier technical audit
A supplier audit should verify the product boundary, drawing-review process, material understanding, geometry design, manufacturing route, outsourced stages, inspection, sample validation, version management, batch consistency, abnormal-response process and regrind support.
Ask for records that match the claim. An equipment photo supports the existence of equipment, not a tolerance. A product photo supports the tool’s existence, not tool life. A capability statement should connect a released drawing, product revision, inspection method and repeated output.
17.3 Four buyer profiles
Distributors need product differentiation, project protection, lead time, private-label rules, technical material, failure support and predictable replenishment.
Engineering procurement teams need total cost, dual-source risk, documentation, change control, sample approval, capacity and commercial terms.
Tier 1 and Tier 2 suppliers need production validation, traceability, capacity, revision control, customer-specific documents and multi-plant consistency.
Machine shops need usable cutting performance, setup guidance, rapid problem solving, low scrap and predictable tool changes. Small shops may value a standard tool and quick support more than a technically elegant custom design.
17.4 Two-stage RFQ
The first contact should not require every technical field. It should collect reachable contact information, the concrete machining task and enough context to route the inquiry. The engineering stage can request the drawing/revision, material/condition, feature, tolerance and surface requirements, current process, machine/holder, runout, coolant, volume, failure mode, inspection and sample requirement.
This improves conversion without weakening engineering discipline. Unknown fields can be resolved during review rather than used to block the first inquiry.
Section judgment: buying criteria are moving from tool price toward validated production economics, documentation and supply risk. Suppliers that make the engineering path easy can compete without being the lowest quoted unit price.
18. Opportunity Matrix for 2026–2030
18.1 Scoring framework
Score each opportunity from 1 to 5 on nine dimensions: market demand, machining difficulty, tool value per application, repeat purchase, switching cost, competitive intensity, qualification difficulty, HENTRY capability and customer-access difficulty.
Competition, qualification and access are inverse scores: 5 means favorable/easier. Do not hide a gating weakness inside an average. An opportunity with unverified capability must remain conditional even if its numerical score is high.
18.2 Opportunity assessment
| Opportunity | Demand source | Technical problem | Product route | Commercial value | Entry barrier | HENTRY status | Evidence required | Next action |
|---|---|---|---|---|---|---|---|---|
| High-silicon aluminum PCD reaming | Automotive housings and wear-intensive aluminum bores | Abrasive wear, size/finish drift and built-up edge | Application-specific PCD reamer | Accepted bores, fewer changes and controlled drift | Geometry, guide and validation | Priority; verify by case | Tool, drawing, inspection trend and accepted-part count | Package one approved application |
| EV motor/reducer housings | Electric-drive manufacturing | Bearing bores, coaxial relationships and sealing faces | PCD reaming/boring/milling and combination tools | Fewer setups, controlled relationships and cycle | Program access and qualification | Adjacent/verify | Part-feature map, sample and inspection | Target drawing-based RFQs |
| Aluminum chassis precision holes | Knuckles, subframes and safety systems | Burr, wear, diameter and feature relationships | Carbide/PCD drilling and reaming | Repeat volume and quality control | Automotive approval | Adjacent/verify | Material, tool revision and production record | Build content and trial plan |
| Solid carbide drilling in steel/stainless | Broad machinery, valves and components | Chip evacuation, heat, breakage and hole consistency | Coated through-coolant solid carbide drill | Large addressable task and repeat stock | Intense competition | Priority family; application proof needed | Grades, diameters, coolant and failure evidence | Build material-specific range and diagnostics |
| CFRP and composite holes | Aerospace and composite structures | Delamination, fiber breakout and abrasive wear | Composite geometry, PCD or diamond-coated route | High failure cost and wear challenge | Qualification and stack complexity | Evidence developing | Actual tools, edge/defect inspection and stack boundary | Publish only verified applications |
| Drill–ream–chamfer combination tools | Automotive and general engineering | Multiple tools, changeover and accumulated variation | Custom carbide or PCD combination tool | Cycle and tool-change reduction | Shared cutting window and regrind | Strong strategic fit | Drawing, baseline cycle, inspection and repeat volume | Standardize feasibility review |
| Hydraulic valve and compressor parts | General engineering and mobile equipment | Sealing bores, cross holes and burrs | Drill, reamer, boring or form combination | High feature value and repeat programs | Fragmented customers | Attractive adjacent | Feature-specific case and cost model | Build application cluster |
| Regrinding and lifecycle service | Installed repeat tools | Cost, availability and controlled edge recovery | Regrind/recoat/inspection service | Retention and lifecycle value | Logistics and process control | Scope to confirm | Recovery yield, turnaround and performance record | Define service boundary |
| Distributor OEM/ODM | Regional channels | Differentiated range, protected projects and documentation | Standard and custom private-label supply | Scale and market access | Channel trust and inventory | Strategic | Change control, packaging, support and repeat supply | Build partner program |
18.3 Portfolio decision
The highest-priority group combines precision holemaking, repeat production and observable quality economics. PCD reamers, carbide drills and combination tools should receive the first evidence and content investment. CFRP and lifecycle services are promising but require a tighter proof set. Applications outside the equipment, material and inspection boundary should remain development options, not public capability claims.
Section judgment: the opportunity matrix is a resource-allocation tool. It should be updated with HENTRY inquiry, quotation, trial and repeat-order data rather than left as a qualitative marketing table.
19. Qualitative Demand Scenarios for 2027–2030
19.1 Why this report does not publish a numerical forecast
Public cutting-tool, manufacturing, machine-tool, aerospace, automotive, raw-material and inventory series do not share one product boundary, unit, geography or release calendar. A weighted index would require a separate, downloadable calculation file containing the raw series, baseline values, normalization rules, missing-value policy and sensitivity tests. This public report therefore uses qualitative scenarios instead of exact index points or growth ranges.
19.2 Scenario decision table
| Scenario | Leading signals | Likely demand effect | Procurement and supply action |
|---|---|---|---|
| Downside | Cutting-tool shipment units, manufacturing utilization and machine-tool orders fall together; end-user pull weakens | Standard-tool destocking; discretionary optimization projects slow; qualified replacement demand may be more resilient | Reduce slow-moving inventory, protect registered projects and avoid treating price-led revenue as physical demand |
| Base | Aerospace improves, automotive remains regionally divided and tungsten stays volatile but available | Nominal revenue may grow faster than physical use; project-specific and high-performance demand remains selective | Manage project inventory, review quote validity and validate demand before adding standard stock |
| Upside | Unit shipments grow and are confirmed by at least two downstream indicators, such as utilization, aircraft deliveries, vehicle programs or machine-tool orders | High-performance and custom-tool demand strengthens; distributor restocking is supported by end-user pull | Secure critical material and qualified capacity early while maintaining drawing and revision control |
19.3 Monitoring and scenario-change rules
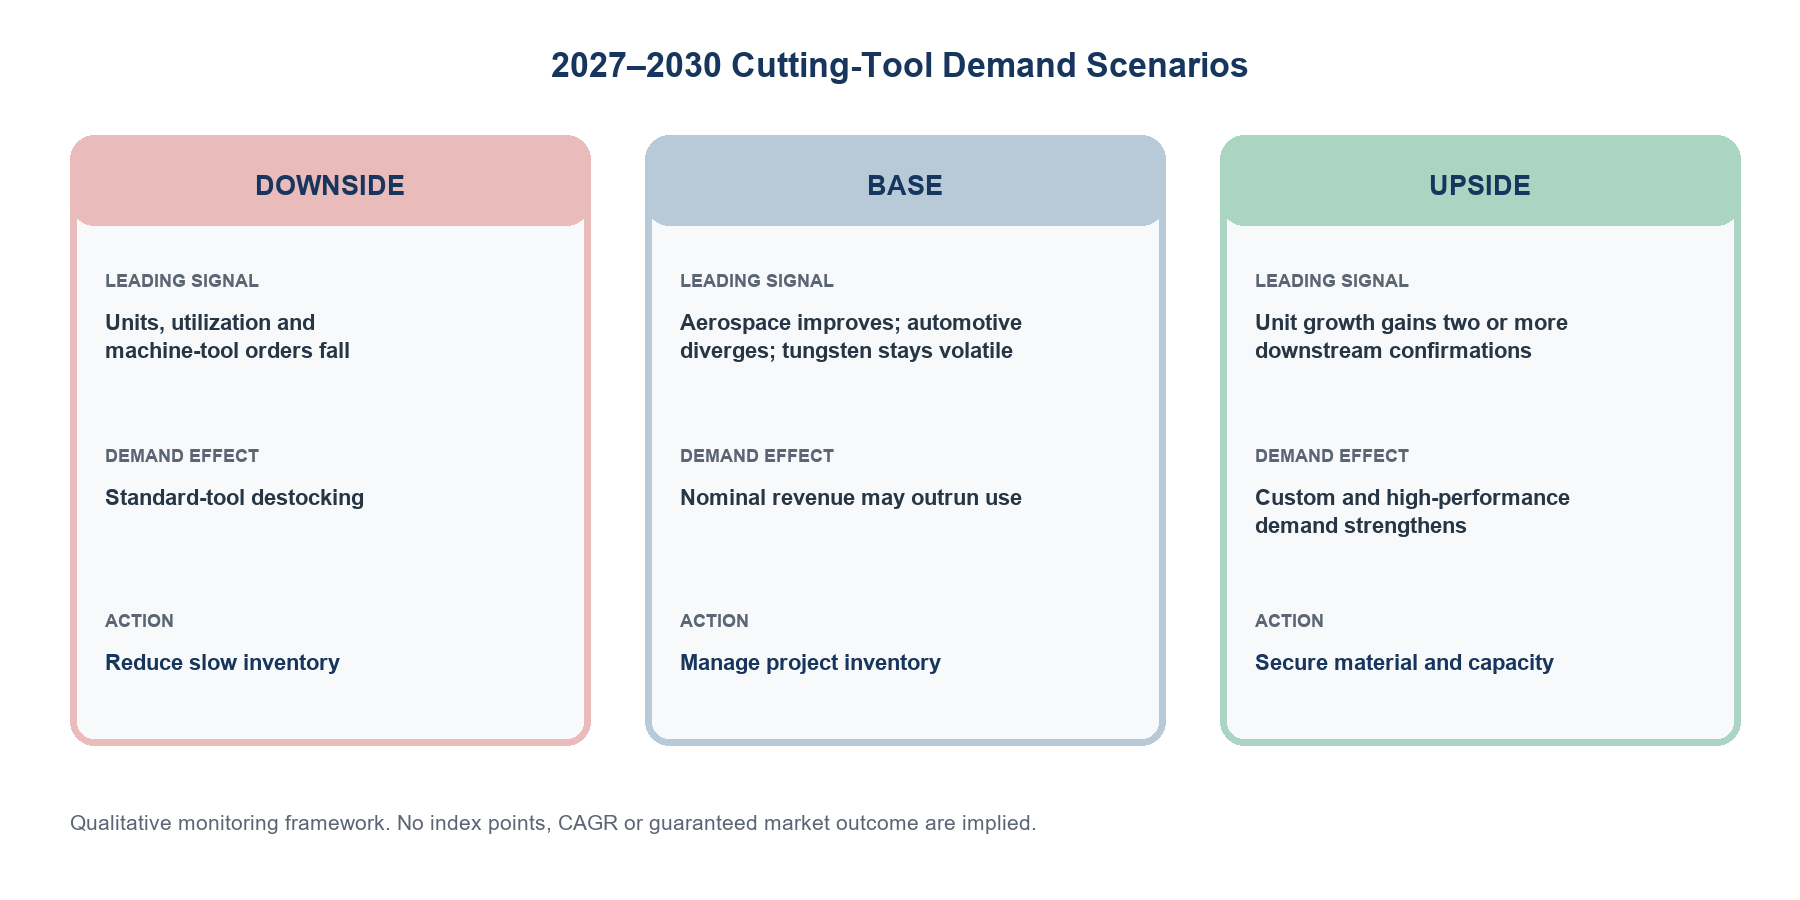
Shipment value alone cannot confirm the upside case because price and mix can lift revenue without more tool units. A scenario review should begin when at least two independent indicators move in the same direction for two consecutive reporting periods. Missing unit or distributor-inventory data must remain identified as missing rather than replaced by revenue. The downside case is not triggered by one volatile monthly release, and the upside case is not confirmed by one aircraft or automotive announcement.
Evidence note. The scenarios are HENTRY industry judgments based on the public indicators cited in this report. They are not a global market-size forecast, a CAGR, revenue guidance or a guarantee of tool demand. Updated 13 October 2026.
Section judgment: scenarios are useful only when they define observable signals and corresponding actions. A reproducible numerical model should be published separately with its calculation file.
20. Implications for Cutting-Tool Buyers and Suppliers
20.1 What distributors should review
Distributors should separate standard replenishment from registered engineering projects. Review inventory by demand class, not only total value: fast-moving standards, project stock, customer-specific tools, tools awaiting regrind and slow items. A tungsten-driven price increase can make inventory value rise while physical availability stays unchanged. Project protection, revision control and abnormal-response ownership should be agreed before a trial begins.
20.2 What procurement teams should verify
Compare suppliers on accepted-part economics, evidence and supply resilience. Verify the released drawing, workpiece material and condition, tool construction, critical dimensions, inspection method, outsourced stages, raw-material route, change control, sample approval, repeat capacity, lead-time distribution and reconditioning scope. An equipment list supports the existence of assets; it does not prove a tolerance or production capability. Review manufacturing and quality evidence separately from application claims.
20.3 What machining companies should measure
Record accepted parts per tool or edge, wear and defect location, tool-change time, unplanned downtime, cycle time, inspection frequency, scrap/rework, runout, coolant delivery and regrind recovery. Convert time to money using documented machine and labor rates. The winning tool is the route that protects accepted output at the lowest controlled lifecycle cost—not automatically the cheapest tool or the longest isolated life.
20.4 When custom holemaking tools should be considered
Evaluate custom combination holemaking tools when a special diameter, step or form repeats; multiple operations create accumulated error; tool changes constrain cycle or unattended production; annual volume can amortize engineering; or the same standard-tool failure persists after setup variables are controlled. Keep separate operations when cutting windows conflict, chips cannot escape, sections wear at very different rates or inspection and adjustment would become harder.
20.5 What to include in an engineering review
Provide the drawing and revision, workpiece material and condition, feature dimensions, tolerance and surface requirements, current process, machine and holder, measured runout, coolant route and pressure/flow where known, hole depth, entry/exit condition, batch and annual volume, current tool life, failure mode, inspection method and sample acceptance plan. Unknown fields can be resolved during review, but assumptions must be documented.
For a defined PCD, carbide-drill, reamer or combination-tool application, HENTRY can review the drawing and machining conditions before proposing a trial route. A recommendation should state the application boundary, validation inputs and acceptance criteria; it should not imply a production capability that has not been technically approved.
Request a Cutting Tool Application Review
Send HENTRY your:
- drawing and revision;
- workpiece material and condition;
- hole dimensions, tolerances and surface requirements;
- machine, holder and measured runout;
- coolant method and known pressure or flow;
- current tool and failure mode;
- annual volume and target tool life.
Final judgment: the 2026 cutting-tool industry is moving through a regionally uneven, price-affected recovery while structural demand shifts toward difficult materials, precision features, automation, traceability and supply resilience. End-market growth creates potential cutting time; part material and feature complexity determine tooling intensity; process control determines accepted output; and supplier evidence determines who can convert the opportunity.
References
[1] AMT / United States Cutting Tool Institute, “July 2026 U.S. Cutting Tool Shipments Totaled $278.1M, Up 29% From July 2025,” published 15 September 2026, accessed 13 October 2026. Measurement boundary: reported U.S. cutting-tool shipments by participating companies; values are not global end-use consumption. https://www.amtonline.org/topic/intelligence/cutting-tool-market-report
[2] VDW, “Upward trend confirmed: machine-tool orders grow 12% in the second quarter,” H1 2026, published 9 September 2026, accessed 13 October 2026. Measurement boundary: German machine-tool orders, not cutting-tool consumption. https://vdw.de/aufwaertstrend-bestaetigt-auftragseingang-im-werkzeugmaschinenbau-waechst-im-zweiten-quartal-um-12-prozent/
[3] CECIMO, “Economic recovery remains fragile amid persistent structural pressures,” 2025 production and 2026 outlook, accessed 13 October 2026. Measurement boundary: European machine-tool production. https://www.cecimo.eu/news/cecimo-press-release-economic-recovery-remains-fragile-amid-persistent-structural-pressures/
[4] Kennametal, “Fiscal 2026 Second Quarter Results,” accessed 13 October 2026. Measurement boundary: company disclosure; includes customer buy-ahead related to tungsten pricing. https://investors.kennametal.com/news-releases/news-release-details/kennametal-announces-fiscal-2026-second-quarter-results
[5] Airbus, “Orders and Deliveries,” September 2026 update, accessed 13 October 2026. Measurement boundary: commercial-aircraft orders and deliveries; dynamic page. https://www.airbus.com/en/products-services/commercial-aircraft/orders-and-deliveries
[6] Airbus, “Airbus Reports Half-Year (H1) 2026 Results,” July 2026, accessed 13 October 2026. Measurement boundary: company H1 results; backlog fixed at 30 June 2026. https://www.airbus.com/en/newsroom/press-releases/2026-07-airbus-reports-half-year-h1-2026-results
[7] Boeing, “Boeing Reports Second-Quarter 2026 Results,” accessed 13 October 2026. Measurement boundary: company Q2 results, Commercial Airplanes deliveries and backlog. https://investors.boeing.com/investors/news/press-release-details/2026/Boeing-Reports-Second-Quarter-Results/
[8] OICA, “Auto Industry Growth Shifted East in 2025 amid Global Repositioning,” accessed 13 October 2026. Measurement boundary: vehicle production by reporting region/country. https://oica.net/auto-industry-growth-shifted-east-in-2025-amid-global-repositioning/
[9] ACEA, “New car registrations: +5.7% in H1 2026; battery-electric 20.7% market share,” accessed 13 October 2026. Measurement boundary: EU new-car registrations, not production. https://www.acea.auto/pc-registrations/new-car-registrations-5-7-in-h1-2026-battery-electric-20-7-market-share/
[10] U.S. Geological Survey, Mineral Commodity Summaries 2026, tungsten chapter, accessed 13 October 2026. Measurement boundary: mine production, trade, policy and price observations; not carbide-tool pricing. https://pubs.usgs.gov/publication/mcs2026
[11] Kennametal, “Fiscal 2026 Full-Year Results,” accessed 13 October 2026. Measurement boundary: company revenue, margins, inventory and cash-flow disclosure; $2.4 billion is approximately $2.4 billion, not $240 million. https://investors.kennametal.com/node/28606
[12] National Bureau of Statistics of China, “Industrial Production in July 2026,” first seven months of 2026, accessed 13 October 2026. Measurement boundary: value-added industrial output; not cutting-tool shipments. https://www.stats.gov.cn/english/PressRelease/202608/t20260817_1965057.html
[13] Japan Machine Tool Builders’ Association, JMTBA Notes, February 2026 issue, published 4 March 2026, accessed 13 October 2026. Original table: January 2026 total orders ¥145,579 million; −8.2% month on month and +25.3% year on year. Measurement boundary: machine-tool orders, not cutting-tool consumption. https://www.jmtba.or.jp/english/wjmtbap/wp-content/uploads/2026/03/JMTBA-NOTES-2026-02.pdf
[14] India Ministry of Statistics and Programme Implementation, “Index of Industrial Production, April 2026,” published 1 June 2026, accessed 13 October 2026. Original release: manufacturing output +6.2% year on year and headline IIP +4.9%; base 2022–23. Measurement boundary: official industrial-production index, not tool demand. https://www.mospi.gov.in/uploads/latestReleases/latest_release_1780371708887_52b83604-666c-443a-82c6-4411103e2ede_Press_Release_IIP_2022-23f.pdf
[15] ASEANstats, Advance Release Calendar, accessed 13 October 2026. The calendar listed 2024 as the latest region-wide Manufacturing Statistics release, scheduled for 1 December 2026, while quarterly international merchandise trade releases extended into 2026. Measurement boundary: regional official statistics with differing datasets and reference periods. https://data.aseanstats.org/arc
[16] U.S. Food and Drug Administration, FY2025 Annual Report on Inspections of Establishments, accessed 13 October 2026. Measurement boundary: registered device establishments; registration does not equal output or approval. https://www.fda.gov/media/192011/download?attachment=
[17] Semiconductor Industry Association, “Global Annual Semiconductor Sales Increase 25.6% to $791.7 Billion in 2025,” published 6 February 2026, accessed 13 October 2026. Measurement boundary: semiconductor sales, three-month moving-average methodology for monthly data. https://www.semiconductors.org/global-annual-semiconductor-sales-increase-25-6-to-791-7-billion-in-2025/
[18] International Energy Agency, World Energy Investment 2026, published 28 May 2026, accessed 13 October 2026. Original release: global energy investment expected to reach $3.4 trillion in 2026, about 5% above 2025, including $2.2 trillion in clean-energy technologies. Measurement boundary: nominal energy-sector capital flows, not machining or tool demand. https://www.iea.org/reports/world-energy-investment-2026
[19] U.S. Geological Survey, Mineral Commodity Summaries 2026, cobalt chapter, accessed 13 October 2026. Measurement boundary: cobalt production, trade, reserves and market observations. https://pubs.usgs.gov/periodicals/mcs2026/mcs2026-cobalt.pdf
[20] ISO, ISO/TC 29/SC 9 catalogue including ISO 13399, accessed 13 October 2026. https://www.iso.org/committee/47464/x/catalogue/p/0/u/1/w/0/d/0
[21] umati, Cutting Tool Definition initiative, accessed 13 October 2026. https://umati.org/ctd/
[22] MTConnect Institute, MTConnect Standard Part 4.2, version 2.5.0, accessed 13 October 2026. https://docs.mtconnect.org/MBSD_MTConnect_Part_4_2-5-0.pdf
[23] Sandvik, “Interim Report, Second Quarter 2026,” accessed 13 October 2026. Measurement boundary: group results, not a pure cutting-tool segment. https://www.home.sandvik/en/news-and-media/news/2026/07/interim-report-second-quarter-2026/
[24] Mitsubishi Materials, “Financial Results Review—Metalworking Solutions,” accessed 13 October 2026. Measurement boundary: reported segment including acquisition and tungsten-product effects. https://ir.mmc.co.jp/en/ir/highlight/review.html
[25] Mitsubishi Materials, “Responsible Supply Chain / Tungsten Recycling,” FY ended March 2025, accessed 13 October 2026. https://ir.mmc.co.jp/en/sustainability/social/supply_chain.html
Glossary
APT: ammonium paratungstate, an intermediate tungsten material and common price reference. PCD: polycrystalline diamond, generally used for compatible non-ferrous and abrasive applications. PCBN: polycrystalline cubic boron nitride, mainly used for hardened ferrous materials and selected cast irons. MQL: minimum-quantity lubrication. Apparent consumption: domestic production plus imports minus exports; inventory is not included in this definition. Price/mix: revenue change caused by selling-price movement and changes in the product/customer mix, separate from physical volume.
Data Verification Notes
| Source | Original statement or table used | Period / release | Scope | Revision status |
|---|---|---|---|---|
| JMTBA[13] | January orders ¥145,579 million; −8.2% month on month; +25.3% year on year | January 2026 / 4 March 2026 | Japan machine-tool orders | Exact PDF and table linked; human data review pending |
| India MoSPI[14] | Manufacturing +6.2% year on year; headline IIP +4.9%; base 2022–23 | April 2026 / 1 June 2026 | India industrial production | Exact release linked; human data review pending |
| ASEANstats[15] | Manufacturing Statistics latest year 2024; release calendar separates later quarterly trade datasets | Calendar accessed 13 October 2026 | ASEAN regional statistics | Exact calendar linked; human data review pending |
| IEA[18] | $3.4 trillion total energy investment; +5% versus 2025; $2.2 trillion clean energy | 2026 outlook / 28 May 2026 | Global energy investment | Exact report page linked; human data review pending |