
Thirty parts, all inside tolerance, is a statement about thirty parts. It is not yet a statement about the process.
A reaming trial only becomes evidence when the same setup produces a mean and a standard deviation you can recalculate, and when those two numbers are compared with the drawing limits rather than with the gauge that happened to pass the parts.
Cp compares the tolerance band with six standard deviations of the process. Cpk does the same and then charges the process for being off centre.
On a 20.000 to 20.021 mm H7 bore, 30 parts with a mean of 20.0105 mm and a standard deviation of 2.8 um give Cp 1.25 and Cpk 1.25; move the mean to 20.0155 mm with the same spread and Cpk falls to 0.65 while Cp stays at 1.25.
Capability numbers are only as good as the sampling plan behind them.
For the tool-side background, the PCD reamer technical centre collects the pages on geometry, allowance and wear that the trial is meant to test.
A capability number is only as good as the sampling behind it: same setup, same tool, same warm-up, same gauge, same operator. The collection rules below exist so the thirty numbers describe the process and not the day.
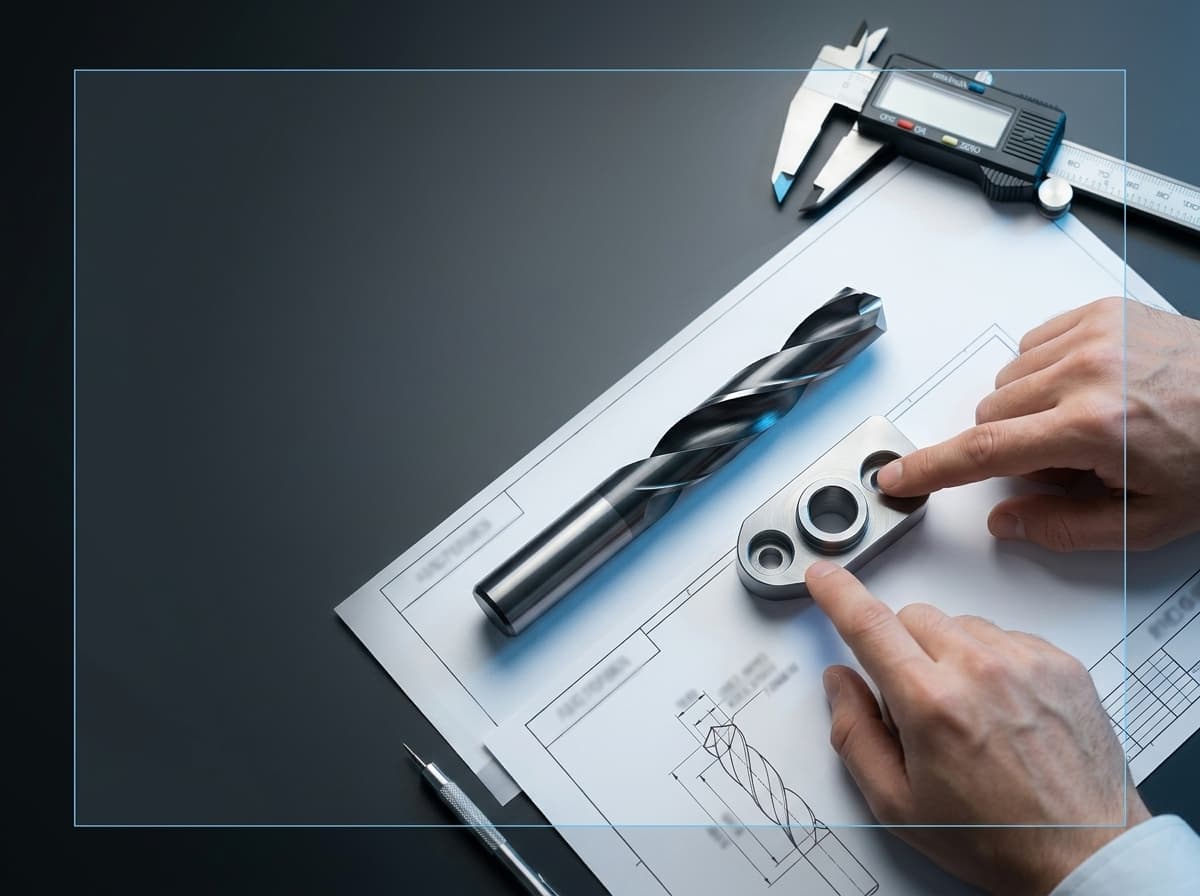
What Cp and Cpk actually compare
Cp is the width of the tolerance band divided by six sigma: (USL - LSL) / (6 sigma). It answers one question, how much room the process spread leaves, and it does not care where the process sits.
Cpk takes the smaller of the two distances from the mean to each limit, divided by three sigma: min[(USL - xbar) / (3 sigma), (xbar - LSL) / (3 sigma)]. It answers the second question, how much room is left on the tighter side.
Two conventions decide whether the result means anything. First, use the drawing limits, not the gauge limits.
A plug gauge that passes a part at the edge of the band hides the part that is 1 um outside it, and a capability study built on go/no-go results is a study of the gauge. Second, sigma must come from the process, not from a tolerance rule of thumb such as a sixth of the band.
If the spread is assumed rather than measured, the index is a restatement of the specification.
The practical reading is simple: Cp good and Cpk poor means the process is capable but set off centre, which is a setup or tool-diameter decision. Cp poor means the spread is too wide for the band, which is a process, machine or measurement decision.
Where we can be wrong: a single trial lot cannot separate a machine that is drifting from one that is merely noisy, because both inflate sigma. That needs a control chart next to the histogram.
Collecting trial data that survives review
A capability number is challenged by the first customer who asks how the parts were produced, so the conditions are recorded at the same time as the diameters. Our rule is thirty consecutive parts, one setup, one tool, one warm-up state, one instrument and one operator.
Three points per bore along the axis, plus a roundness check on a sample, so a taper cannot hide inside a single section.
| Condition | Why it changes the result | What to record |
|---|---|---|
| Sample size and selection | Fewer than 30 parts gives a sigma that moves with the next part; picking the good ones removes the tail that matters | Sample size, consecutive or lot-based, and the selection rule actually used |
| One setup, one tool, one clamp | A tool change mid-trial mixes two distributions and inflates sigma without any process change | Tool serial number, regrind count, clamped length, fixture and jaw set |
| Warm-up state | A cold spindle drifts during the trial and adds a trend to what should be random scatter | Warm-up time, spindle temperature at start and end, shop temperature |
| Instrument and operator | Two instruments or two operators add a second distribution that the index cannot separate | Instrument type, calibration date, measuring temperature, operator |
| Measurement plan per bore | One section per bore cannot show taper; two-point diameter cannot show a two-lobe bore | Number and position of sections, roundness method, whether parts were measured clamped or free |
None of these rows is optional if the number is going to be quoted to a customer. The rows above are our conditions for a usable record; they are not a claim that every plant must run the trial this way.
A worked example you can recalculate
Bore 20.000 to 20.021 mm, an H7 band of 21 um. Thirty consecutive parts, one tool, one setup. The measured mean is 20.0105 mm and the standard deviation is 2.8 um.
- Cp = (20.021 - 20.000) / (6 x 0.0028) = 0.021 / 0.0168 = 1.25
- Distance to the upper limit: 20.021 - 20.0105 = 0.0105 mm, divided by 3 sigma (0.0084 mm) = 1.25
- Distance to the lower limit: 20.0105 - 20.000 = 0.0105 mm, divided by 3 sigma = 1.25
- Cpk = min(1.25, 1.25) = 1.25
Now leave the same tool, the same spread and the same machine, and move the mean to 20.0155 mm. Cp is unchanged at 1.25, because the spread did not change. The distance to the upper limit is now 0.0055 mm, which gives 0.0055 / 0.0084 = 0.65, so Cpk is 0.65.
Nothing about the process became less stable; it stopped being centred. That is the difference the two indices are for, and it is why a tool diameter decision and a stability decision should not be argued with the same number.
These figures are an arithmetic example written to be recalculated, not a HENTRY trial and not a target. Replace them with your own mean and sigma; the formulas do not change.
Whether 1.33 or 1.67 is the acceptance line is set by the customer's specification or the drawing, not by this page.
Three things a good Cpk can hide
A high index is a statement about one measured feature at one moment. Three failures pass it without argument.
- Taper. If every part is measured at one section, a bore that is 6 um smaller at the far end looks perfectly centred. Three sections per bore at the same axial positions, every time, is the only way the taper appears in the data.
- Roundness. A two-lobe bore measures the same diameter in two directions 90 degrees apart, so a two-point micrometer reports a good size on a bore that will not seal or will not take a bearing. A three-point or roundness check on a sample is what exposes it; how the two methods differ is covered in air gauge versus CMM for reamed bores.
- Tool-life phase. A trial on a new tool describes a new tool. The same tool at the end of its regrind life can produce a wider spread with the same nominal geometry. A capability figure that will be quoted for a production year has to cover the regrind cycle, not only the first thirty parts; the wear side is covered in regrind and reconditioning of PCD reamers.
Where we are cautious: a capability study on aluminium also moves with temperature. If the parts are measured in a cold inspection room straight off a warm machine, part of the sigma is thermal, not process.
Record the measuring temperature with the numbers, and read the drift section in machine-side requirements for PCD reaming before concluding that the process is noisy.
The ten-line trial record
One page per trial is enough. The ten rows below are the minimum we ask for when a trial is sent to us for review, because they let another engineer rebuild the number without a phone call.
| Record line | What goes in it |
|---|---|
| 1. Part and drawing | Part number, drawing revision, bore diameter and tolerance class as written on the drawing |
| 2. Feature | Bore diameter, depth, through or blind, wall thickness, distance to the nearest edge |
| 3. Tool | Tool serial number, geometry, diameter as ground, regrind count |
| 4. Pre-hole | Drill or core diameter, method, measured pre-hole size and roundness |
| 5. Machine and setup | Machine, holder, clamped length, stickout, fixture and clamping force |
| 6. Coolant | Type, concentration, pressure at the tool inlet, through-tool or external |
| 7. Sample | Sample size, consecutive or lot-based, sampling interval, parts rejected and why |
| 8. Measurement | Instrument, calibration date, number and position of sections, temperature, clamped or free |
| 9. Results | Mean, sigma, Cp, Cpk, min and max, plus roundness and taper spot checks |
| 10. Disposition | Accepted, re-run with a change, or held; what was changed and who signed it |
The rows above are a template, not a form to be filed. Their value is that they force the temperature, the regrind count and the section positions onto the same page as the index, which is where most challenges to a capability number end.
The ten-line record is deliberately short: it fits on one sheet, it survives a customer audit, and every line maps to a field in the calculation above. Fill it during the trial, not afterwards.
Send thirty numbers, not a summary
If a reamed bore is failing a capability requirement, send the thirty diameters, the drawing limits and the ten-line record rather than the index alone.
We can recalculate Cp and Cpk from the raw values, check whether the spread or the centring is the problem, and say whether the next step is a tool diameter change, a pre-hole change or a machine check.
Use the custom cutting tool RFQ for the data and drawing, and the sample validation process if the trial is meant to become an approved production tool.
What published sources say about this
These are the pages we used for the statistical definitions and the measurement discipline behind them.
- 6.1.6. What is Process Capability? (NIST/SEMATECH e-Handbook of Statistical Methods): defines capability as the comparison of an in-control process output with the specification limits, which is the basis for using Cp and Cpk only after the process is stable.
- 6.1.5. What to do if "In Control" but Unacceptable? (NIST/SEMATECH): separates being in control from being capable, the distinction behind the Cp-versus-Cpk reading on this page.
- 6.3.1. What are Control Charts? (NIST/SEMATECH): control charts for separating common-cause from special-cause variation, which is what a capability study assumes has already been done.
- 1.3.5.10. Levene Test for Equality of Variances (NIST/SEMATECH): a test for whether two sets of measurements share a spread, useful when a tool change or a regrind is suspected of changing sigma.
- 6.1.4. What to do if the process is "Out of Control"? (NIST/SEMATECH): the reaction sequence when a chart signals, which should be completed before any capability index is quoted.
- 6.3.2. What are Variables Control Charts? (NIST/SEMATECH): charts for measured values such as bore diameter, the natural companion of a trial that records means and sigma.
- 6.4.1. Definitions, Applications and Techniques (NIST/SEMATECH): capability and performance indices, their assumptions and their limits.
- Two-Way Nested ANOVA (NIST/SEMATECH): nested sources of variation such as parts within batches or operators within shifts, which is how a trial hides a second variance component.
- What do we mean by "Normal" data? (NIST/SEMATECH): the distribution assumption behind interpreting six sigma as the process width.
- Do the observations come from a particular distribution? (NIST/SEMATECH): tests to run before quoting a capability index on thirty readings.
Outbound references on this page are limited to pages we opened on 10 November 2026 (Asia/Shanghai). The worked example is arithmetic, not a HENTRY trial; acceptance thresholds such as 1.33 or 1.67 are set by the customer specification, not by the sources above.
Frequently asked questions
What sample size does a reaming capability study need?
Thirty consecutive parts is the working minimum for a first look, because the estimate of sigma is still uncertain below that.
It is not a guarantee: if the tool wears visibly across the run, thirty parts describe a trend rather than a stable process, and a control chart of the same data will show it.
For a number that will be quoted for production, repeat the study at the start and the end of the regrind cycle.
Is Cpk 1.33 enough for a reamed bore?
That depends on the drawing and the customer, not on the process alone. 1.33 and 1.67 are common internal targets, and some automotive drawings ask for more on safety-related features.
Our advice is to agree the number before the trial, write it on the trial record, and state which sigma was used; a Cpk quoted without that context cannot be compared with another plant's.
Should the study use gauge limits or drawing limits?
Drawing limits, always. Gauge limits are acceptance limits for a gauge and are already inside the drawing band, so an index calculated from them is optimistic. If only go/no-go results exist, the data cannot support a capability index; measure the diameters.
Why can Cp be good while Cpk is poor?
Because the spread fits the band but the mean sits away from the middle. On the example above, moving the mean by 5 um changed Cpk from 1.25 to 0.65 while Cp stayed at 1.25.
In production that is usually a tool diameter or a setup offset, and it is corrected by centring the process rather than by reducing variation.
Updated 10 November 2026: added in-article figures; expanded outbound sources to the NIST/SEMATECH handbook; vendor homepage reference removed. First published the same day. Scope: turning a reaming trial into Cp and Cpk, the sampling conditions behind it, and the three failures a high index can hide. All numbers are worked examples for recalculation, not HENTRY measurements.